GWS’s OneScore Methodology & 2019 Results

Global Wireless Solutions (GWS) evaluates wireless networks according to the company’s OneScore methodology. At the moment, AT&T cites GWS’s results in commercials where AT&T claims to offer the best network.

In an article about performance tests of wireless networks, GWS’s founder, Dr. Paul Carter, writes:1

With so many conflicting research reports and with every network touting itself as number one, it’s critical that wireless carriers are transparent about how and what they actually test. If what was tested doesn’t match up with the average consumer experience, then was that test truly worthwhile?

Unfortunately, GWS itself is not especially transparent about its methodology. The public-facing information about the company’s methodology is sparse, and I did not receive a response to my email requesting additional information.

As I understand it, GWS’s methodology has two components:

  • Technical performance testing in about 500 markets
  • Consumer surveying that helps determine how much weight to give different metrics

Technical testing

In 2019, GWS conducted extensive drive testing; GWS employees drove close to 1,000,000 miles as phones in their vehicles performed automated tests of networks’ performance.2

The drive testing took place in about 500 of the markets, including all of the largest metropolitan areas. GWS says the testing represents about 94% of the U.S. population.3 I expect that GWS’s focus on these markets limits the weight placed on rural and remote areas. Accordingly, GWS’s results may be biased against Verizon (Verizon tends to have better coverage than other networks in sparsely populated areas).

Consumer surveying

In 2019, GWS surveyed about 5,000 consumers to figure out how much they value different aspects of wireless performance.4 GWS finds that consumers place a lot of importance on phone call voice quality, despite the fact the people are using their phones for more and more activities unrelated to phone calls.5 GWS also finds that, as I’ve suggested, consumers care a lot more about the reliability of their wireless service than its raw speed.6

Combining components

As I understand it, GWS draws on the results of its surveying to decide how much weight to place of different aspects parts of the technical performance tests:

The consumer survey includes questions asking respondents to rank the importance of different tasks they perform on their mobile device, as well as the importance of different aspects of network performance. Our network test results are then weighted according to how consumers prioritize what’s important to them, and evaluated in eleven different network performance areas related to voice, data, network reliability and network coverage.

The methodology’s name, OneScore, and the graphic below suggest that the company combines all of its data to arrive at final, numerical scores for each network:7

GWS OneScore Visual

Oddly enough, I can’t find GWS publishing anything that looks like final scores. That may be a good thing. I’ve previously gone into great detail about why scoring systems that use weighted rubrics to give companies or products a single, overall score tend to work poorly.

2019 Results

In GWS’s 2019 report, the company lists which networks had the best performance in several different areas:

AT&T:

  • Download speed
  • Data reliability
  • Network capacity
  • Video streaming experience
  • Voice accessibility
  • Voice retainability

T-Mobile:

  • Voice quality

Verizon:

  • Upload speed

Open questions

I have a bunch of open questions about GWS’s methodology. If you represent GWS and can shed light on any of these topics, please reach out.

  • Does the focus on 501 markets (94% of the U.S.) tend to leave out rural areas where Verizon has a strong network relative to other operators?
  • Do operators pay GWS? Does AT&T pay to advertise GWS’s results?
  • What does the consumer survey entail?
  • How directly are the results of the consumer survey used to determine weights used later in GWS’s analysis?
  • What does GWS make of the discrepancies between its results and those of RootMetrics?
  • How close were different networks’ scores in each category?
  • GWS shares the best-performing network in several categories. Is information available about the second, third, and fourth-place networks in each category?
  • Does GWS coerce its raw data into a single overall score for each network?
    • Are those results publicly available?
    • How are the raw performance data coerced into scores that can be aggregated?

Dawson On The Government’s Role In 5G

I recently stumbled across a fantastic post by Doug Dawson about the government’s role in 5G. Here’s a bit of it (emphasis mine):

It’s been really interesting to watch how much the federal government talks about 5G technology. I’ve not seen anything else like this in my adult lifetime…I’ve been hearing about the 5G war for a few years now and I still don’t know what it means. 5G is ultimately a broadband technology. I can’t figure out how the US is harmed if China gets better broadband. If there is now a 5G war, then why hasn’t there been a fiber-to-the-home war? I saw recently where China passed us in the number of last-mile fiber connections, and there wasn’t a peep about it out of Congress…Cellular carriers worldwide are crowing about 5G deployment, yet those deployments contain none of the key technology that defines 5G performance. There is no frequency slicing. There is no bonding together of multiple frequencies to create larger data pipes. There is no massive expansion of the number of connections that can be made at a website. Cellphones can’t yet connect to multiple cell sites. What we have instead, for now, are new frequencies layered on top of 4G LTE…The carriers admit that the 600 MHz and the 850 MHz spectrum being deployed won’t result in faster speeds than 4G LTE…It’s starting to look like the real reason for the talk about a 5G war is to drum up sympathy for the big cellular carriers as a justification for big government giveaways.

I mostly agree with Dawson, and I strongly recommend the full post.

US Mobile’s New Unlimited Plans – Well-Priced With Some Limits & Hidden Fees

The carrier US Mobile recently released new unlimited plans. As with US Mobile’s old plans, customers can choose either the Super LTE network or the GSM LTE network. Super LTE runs over Verizon’s network while GSM LTE runs over T-Mobile’s network. Plans appear to be priced the same regardless of the network a subscriber chooses.1

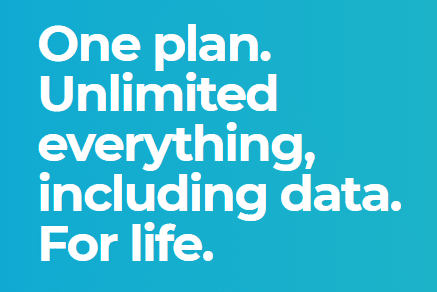
“Unlimited” is a bit of a misnomer for US Mobile’s new plans. The plans have limits, but the limits are dependent on which options subscribers select. Customers can choose either US Mobile’s “Fast” plan or its “Ludicrous” plan.

Limits

As I understand them, here are the limits on the Fast plan (base price of $40 per month):

  • Speeds are usually throttled to a maximum of 5Mbps
  • If 50GB of data is used in a single month, speeds are throttled intensely (15GB with GSM)
  • Hotspot use is not permitted (can be added for an additional $5 per month)

The Ludicrous plan has a base price of $50 per month. The Ludicrous plan does not have a 5Mbps throttle, and mobile hotspot is included. As with the Fast plan, data use beyond 50GB (15GB with GSM) is throttled intensely.

I use the phrase “throttled intensely” because US Mobile doesn’t disclose its policies clearly. On its website, the company writes:

Super LTE plans come with 50GB of high-speed data. A tiny fraction of heavier data users may notice reduced speeds afterwards.
While I appreciate the disclosure, I think there’s a lot wrong with it. While I interpreted it as indicating that speeds would be throttled intensely, a Reddit user thought the disclosure implied US Mobile customers normally would have high priority during congestion but would receive low priority after 50GB of data use.

A US Mobile agent I reached out to confirmed that there is a throttle after the threshold level of data use is reached. The agent seemed reluctant to mention a specific speed cap but explained that speeds would feel like 2G. Following the argument I made in Unlimited Plans At 2G Speeds Are Bogus, I think it would be more transparent if US Mobile called their plan a 50GB plan. Extra data at slow speeds could just be a little perk. That said, I understand the carrier caving to the pressure to call its plans “unlimited”.

I don’t love the phrasing of “A tiny fraction of heavier data users may notice reduced speeds.” It seems to suggest that only some of the people who pass the threshold will have reduced speeds. As I understand it, US Mobile is imposing a serious speed cap on everyone who passes the threshold of 50GB. I’d suggest an alternate phrasing along the lines of Heavy data users, who make up a tiny fraction of our subscriber base, will experience substantially reduced speeds after 50GB of use..”

Are The Plans Competitive?

US Mobile’s Super LTE unlimited plans look competitively priced for those who only need one or two lines and want service over Verizon’s network. Large families can probably get better per-line rates by purchasing service from Verizon directly (Verizon drops its per-line rates on unlimited plans as more lines are added).

Unlimited plans purchased from Verizon’s Flanker brand, Visible, may be cheaper than US Mobile’s plans, but regular issues and limited device options with Visible may make US Mobile a better bet.

US Mobile also includes some other companies’ services as perks with their unlimited plans. Here’s a screenshot from the carrier’s website:

List of US Mobile Perks

Hidden Fees

On the new unlimited plans, it seems US Mobile is still hiding fees. Most consumers won’t see these fees until after they’ve ordered a SIM card:

US Mobile's hidden fees

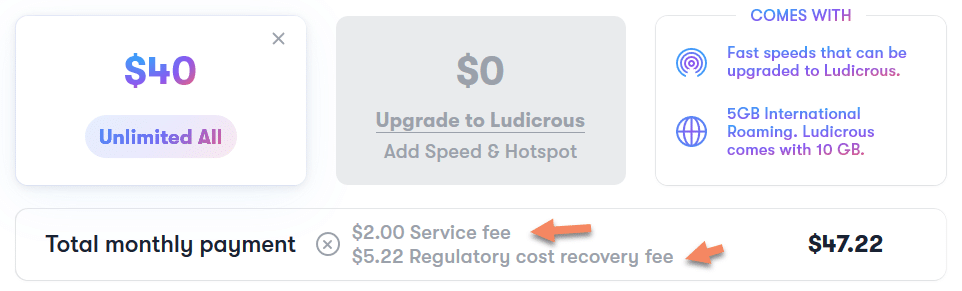
Both fees are annoying. One could argue the regulatory recovery fee is at least a fee that many other carriers are also hiding. The $2 per month service fee is unusual.

Plan Finder Tool Released

Last week, I released a new plan finder tool. Users accessing the tool can answer a few questions about how they use their phones, how budget-sensitive they are, and where they live. They’ll then be matched with a few carriers and plans that are likely to be well-suited for their needs.

Competing Tools

A few other companies have released their own plan finder tools. These tools generally function by assuming the wireless industry is simpler and more commoditized than it is. For example, WhistleOut’s tool appears to assume that cell phone plans have only five features:

  • A host network
  • An allotment of data
  • An allotment of minutes
  • An allotment of texts
  • A price

The allotments are all assumed to take fixed, numerical values. Plans’ prices are also assumed to take simple, fixed values. The host network is simply one of five options (Verizon, AT&T, T-Mobile, Sprint, or U.S. Cellular). Making these assumptions allows many carriers’ plans to be compared, sorted, and filtered with basic math and logic. Unfortunately, the assumptions sweep a lot of important nuances under the rug. For example:

  • Carriers may throttle data speeds or ignore data use from certain applications. Complicated data policies can’t be captured when assuming that plans have simple, fixed data allotments.
  • Pricing may not be fixed. E.g., Mint Mobile has one price for subscribers that purchase 3 months of service upfront and another price for those who purchase 12 months of service upfront.
  • Two services that use the same host network could have different levels of priority during congestion.
  • Factors WhistleOut doesn’t account for, like device compatibility and customer service quality, matter to consumers.

While WhistleOut’s plan finder has a feature for checking coverage, WhistleOut appears to treat coverage as a binary thing⁠—either you have coverage or you don’t. In reality, coverage quality is much richer. You can have mediocre coverage or strong coverage. You can have good coverage at your house but problematic coverage where you work.

CoverageCritic’s Tool

While building CoverageCritic’s plan finder, I tried to account for things like prices, resource allotments, and coverage quality but kept in mind that these aspects of wireless service are complicated and often difficult to fully capture in simple models. While I can’t claim my tool is exclusively driven by hard data, I think my approach makes the tool more useful than competitor’s tools.

CoverageCritic’s tool makes predictions about coverage quality after drawing on geographic information provided by users. At the moment, state-level estimates of coverage quality are combined with user-provided information about population density. Population density proxies for coverage quality and is used to adjust state-level coverage estimates to arrive at location-specific predictions of coverage quality. In the future, I hope to refine the predictions of coverage quality by drawing on much larger data sets from carriers and network evaluators.

At the moment, the tool considers services from about ten carriers, and I plan to add more soon. The tool isn’t perfect, but it should be able to provide most consumers with a good starting point as they search for wireless providers.

FCC Reveals Misleading Coverage Claims

On Wednesday, the FCC released a fascinating report related to the Mobility Fund Phase II (MF-II). The MF-II is a planned program to provide federal funding for network build-outs in rural areas that are underserved by 4G coverage.

To determine which geographic areas were underserved, the FCC requested coverage maps and data from network operators. After reviewing the data and allowing outside entities to challenge the datas’ reliability, the FCC became concerned about the accuracy of the information shared by T-Mobile, U.S. Cellular, and Verizon. The FCC decided to conduct its own performance tests and compare the results of its tests to the information the network operators provided. Here’s what the agency found:1

Through the investigation, staff discovered that the MF-II coverage maps submitted by Verizon, U.S. Cellular, and T-Mobile likely overstated each provider’s actual coverage and did not reflect on-the-ground performance in many instances. Only 62.3% of staff drive tests achieved at least the minimum download speed predicted by the coverage maps—with U.S. Cellular achieving that speed in only 45.0% of such tests, T-Mobile in 63.2% of tests, and Verizon in 64.3% of tests…In addition, staff was unable to obtain any 4G LTE signal for 38% of drive tests on U.S. Cellular’s network, 21.3% of drive tests on T-Mobile’s network, and 16.2% of drive tests on Verizon’s network, despite each provider reporting coverage in the relevant area.

Incentives

When considering the accuracy of coverage maps, I try to think about the incentives network operators face. When advertising to consumers, network operators often have an incentive to overstate the extent of their coverage. However, incentives can run in the opposite direction in other situations. For example, when trying to get approval for a merger between Sprint and T-Mobile, Sprint had incentives to make its 4G coverage profile look limited and inferior to the coverage profiles of other nationwide networks.2

I’m not well-informed about the MF-II, so I don’t feel like I have a good grasp of all the incentives at play. That said, it’s not clear that all network operators would have an incentive to overstate their coverage. A network operator that claimed to offer coverage in an area it didn’t cover may limit competitors’ access to subsidies in that area. However, a network operator erroneously claiming to cover an area may prevent itself from receiving subsidies in that area.

Challenges

After network operators submitted coverage information to the FCC, a number of entities, including both governments and network operators, were allowed to challenge the validity of coverage information submitted by others. Here’s a bit more detail about the challenge process:3

After release of the map of presumptively eligible areas, mobile service providers, state, local, and Tribal government entities, and other interested parties granted a waiver were eligible to submit challenges in the challenge process via an online system operated by USAC. Challengers that requested access to the USAC MF-II Challenge Portal were able to access the provider-specific coverage maps, after agreeing to keep the coverage data confidential, and to file challenges to providers’ coverage claims by submitting speed test data. Challengers were required to conduct speed tests pursuant to a number of standard parameters using specific testing methods on the providers’ pre-approved handset models. The Commission adopted the requirement that challengers use one of the handsets specified by the provider primarily to avoid inaccurate measurements resulting from the use of an unsupported or outdated device—e.g., a device that does not support all of the spectrum bands for which the provider has deployed 4G LTE…During the eight-month challenge window, 106 entities were granted access to the MF-II Challenge Portal. Of the 106 entities granted access to the MF-II Challenge Portal, 38 were mobile service providers required to file Form 477 data, 19 were state government entities, 27 were local government entities, 16 were Tribal government entities, and six were other entities that filed petitions requesting, and were each granted, a waiver to participate.

About a fifth of the participating entities went on to submit challenges:4

21 challengers submitted 20.8 million speed tests across 37 states.

The challenge data often showed failed tests and lackluster speeds in areas where network operators claimed to offer coverage:5

During the challenge process, some parties entered specific concerns into the record. For example:6

Smith Bagley (d/b/a Cellular One) submitted maps of its service area in Arizona overlaid with Verizon’s publicly-stated 4G LTE coverage and the preliminary results of drive tests that Smith Bagley had conducted. Smith Bagley asserted that, for large stretches of road in areas where Verizon reported coverage, its drive testers recorded no 4G LTE signal on Verizon’s network. Smith Bagley argued that the ‘apparent scope of Verizon’s inaccurate data and overstated coverage claims is so extensive that, as a practical matter, the challenge process will not and cannot produce the necessary corrections.’
As part of a public report detailing its experience, Vermont published a map showing its speed test results which contradicted the coverage maps in Vermont of U.S. Cellular, T-Mobile, and Verizon, among others. This map included information on the approximately 187,000 speed tests submitted by Vermont, including download speed, latency, and signal strength. In the report, Vermont detailed that 96% of speed tests for U.S. Cellular, 77% for T-Mobile, and 55% for Verizon failed to receive download speeds of at least 5 Mbps.

After reviewing the challenges, the FCC requested additional information from the five largest network operators (AT&T, T-Mobile, Verizon, Sprint, and U.S. Cellular) to understand the assumptions involved in the networks’ coverage models.

FCC tests

Around the same time the FCC was requesting additional information from network operators, the agency also began its own testing of Verizon, U.S. Cellular, and T-Mobile’s networks. These speed tests took place in 12 states and primarily made use of a drive-testing methodology. As mentioned earlier, analyses of the FCC’s test data suggested that the on-the-ground experience with Verizon, T-Mobile, and U.S. Cellular’s network was much different than the experience that would be expected based on the information the networks provided to the FCC.

What happened?

A lot of the commentary and news articles I’ve seen in response to the FCC’s report seem to conclude that network operators are bullshitters that intentionally lied about the extent of their coverage. I have reservations about fully accepting that conclusion. Accurately modeling coverage is difficult. Lots of factors affect the on-the-ground experience of wireless subscribers. The FCC largely acknowledges this reality in its report:

Providers were afforded flexibility to use the parameters that they used in their normal course of business when parameters were not specified by the Commission. For example, the Commission did not specify fading statistics or clutter loss values, and providers were required to model these factors as they would in the normal course of business.7
Our speed testing, data analyses, and inquiries, however, suggest that some of these differences may be the result of some providers’ models: (1) using a cell edge RSRP value that was too low, (2) not adequately accounting for network infrastructure constraints, including backhaul type and capacity, or (3) not adequately modeling certain on-the-ground factors—such as the local clutter, terrain, and propagation characteristics by spectrum band for the areas claimed to be covered.8

Further supporting the idea that assessing coverage is difficult, the FCC didn’t just find that its tests contradicted the initial information submitted by network operators. The FCC data also contradicted the data submitted by those who challenged network operators’ data:

The causes of the large differences in measured download speed between staff and challenger speed tests taken within the same geographic areas, as well as the high percentage of tests with a download speed of zero in the challenger data, are difficult to determine. Discrepancies may be attributable to differences in test methodologies, network factors at the time of test, differences in how speed tet apps or drive test software process data, or other factors…Given the large differences between challenger and staff results however, we are not confident that individual challenger speed test results provide an accurate representation of the typical consumer on-the-ground experience.9

While the FCC found some of the information submitted by networks to be misleading about on-the-ground service quality, I don’t believe it ended up penalizing any network operators or accusing them of anything too serious.10 Still, the FCC did suggest that some of the network operators could have done better:

Staff engineers, however, found that AT&T’s adjustments to its model to meet the MF-II requirements may have resulted in a more realistic projection of where consumers could receive mobile broadband. This suggests that standardization of certain specifications across the largest providers could result in coverage maps with improved accuracy. Similarly, the fact that AT&T was able to submit coverage data that appear to more accurately reflect MF-II coverage requirements raises questions about why other providers did not do so. And while it is true that MF-II challengers submitted speed tests contesting AT&T’s coverage data, unlike for other major providers, no parties alleged in the record that AT&T’s MF-II coverage data were significantly overstated.11

FCC response

The FCC concluded that it should make some changes to its processes:12

First, the Commission should terminate the MF-II Challenge Process. The MF-II coverage maps submitted by several providers are not a sufficiently reliable or accurate basis upon which to complete the challenge process as it was designed.
Second, the Commission should release an Enforcement Advisory on broadband deployment data submissions, including a detailing of the penalties associated with filings that violate federal law, both for the continuing FCC Form 477 filings and the new Digital Opportunity Data Collection. Overstating mobile broadband coverage misleads the public and can misallocate our limited universal service funds.
Third, the Commission should analyze and verify the technical mapping data submitted in the most recent Form 477 filings of Verizon, U.S. Cellular, and T-Mobile to determine whether they meet the Form 477 requirements. Staff recommends that the Commission assemble a team with the requisite expertise and resources to audit the accuracy of mobile broadband coverage maps submitted to the Commission. The Commission should further consider seeking appropriations from Congress to carry out drive testing, as appropriate.
Fourth, the Commission should adopt policies, procedures, and standards in the Digital Opportunity Data Collection rulemaking and elsewhere that allow for submission, verification, and timely publication of mobile broadband coverage data. Mobile broadband coverage data specifications should include, among other parameters, minimum reference signal received power (RSRP) and/or minimum downlink and uplink speeds, standard cell loading factors and cell edge coverage probabilities, maximum terrain and clutter bin sizes, and standard fading statistics. Providers should be required to submit actual on-the-ground evidence of network performance (e.g., speed test measurement samplings, including targeted drive test and stationary test data) that validate the propagation model used to generate the coverage maps. The Commission should consider requiring that providers assume the minimum values for any additional parameters that would be necessary to accurately determine the area where a handset should achieve download and upload speeds no less than the minimum throughput requirement for any modeling that includes such a requirement.

Reflections

The FCC’s report illustrates how hard it is to assess network performance. Assumptions must be made in coverage models, and the assumptions analysts choose to make can have substantial effects on the outputs of their models. Similarly, on-the-ground performance tests don’t always give simple-to-interpret results. Two entities can run tests in the same area and find different results. Factors like the time of day a test was conducted or the type of device that was used in a test can have big consequences.

If we want consumers to have better information about the quality of service networks can offer, we need entities involved in modeling and testing coverage to be transparent about their methodologies.

Tutela’s October 2019 MVNO Report

In October, the network evaluator Tutela released its USA State of MVNOs report. Most network evaluators only assess the performance of the Big Four carriers (AT&T, T-Mobile, Sprint, and Verizon), so it’s interesting to see Tutela assessing a wider range of carriers.

Near the beginning of the report, Tutela shares some reflections on how the MVNO landscape is changing:1

MVNOs and MNO flanker brands in the US carved out a niche largely serving the needs of lower-income customers or those with particular data needs…in 2019, the landscape is rapidly shifting. Technological advancements have made the barrier for operating some kind of network much lower; the entrance of cable companies into the market have pushed MVNO service into the more lucrative postpaid segment; and multi-network MVNOs are innovating on the network side of the equation, rather than solely differentiating on price or customer service.

Methodology

The approach Tutela used to evaluate MVNOs was in line with its usual methodology. The company crowdsourced performance data from typical consumers with the help of code embedded in Tutela’s partners’ apps. In the new report, Tutela primarily considers how well MVNOs performed in regions where at least three of the big four networks offer coverage. Tutela calls these core coverage areas.2

Within core coverage areas, Tutela calculates the amount of time subscribers have service that exceeds two different quality thresholds. When service exceeds the “excellent” threshold, subscribers should be able to do highly demanding things like streaming high-definition video or downloading large files quickly. When service exceeds the “core” threshold, subscribers should be able to carry out typical activities like browsing or streaming music without trouble, but performance issues may be encountered with demanding activities.

Results

Here’s Tutela’s visualization of the main results:3

Tutela results


A chart of median download speeds shows a similar ranking among carriers:

Tutela Download Speeds

The results aren’t too surprising. Verizon MVNOs come out near the top of the hierarchy, while Sprint MVNOs tend to come out near the bottom. Cricket Wireless has a good score for the core threshold but does poorly in terms of the excellent threshold. That outcome makes sense since Cricket throttles maximum speeds.

Possible selection bias

I often write about how assessments of network performance that use crowdsourced data may be vulnerable to selection bias. These results from Tutela are no exception. In particular, I wonder if the results are skewed based on how high-quality phones used with different carriers tend to be. In general, newer or more expensive phones have better network hardware than older or cheaper phones.

Xfinity Mobile takes the top spot in the rankings. Xfinity Mobile is a new-ish carrier and is restrictive about which phones are eligible for use with the service. I would guess the average phone used with Xfinity Mobile is a whole lot newer and more valuable than the average phone used with TracFone. Similar arguments could be made for why Spectrum or Google Fi may have an advantage.

To Tutela’s credit, the company acknowledges the possibility of selection bias in at least one case:4

The second factor explaining Google Fi’s performance compared to Metro or Boost is the device breakdown. Although a broad range of Android and iOS devices work with Google Fi’s service, the network is targeted most heavily at owners of Google’s own Pixel devices…The Pixel devices use top-of-the-line cellular modems, which intrinsically provide a better cellular experience than older or mid-range devices.

Wi-Fi results

Several MVNOs offer access to Wi-Fi hotspots in addition to cellular networks. I’ve been curious how much data carriers send over Wi-Fi, and Tutela’s results give an estimate. While Xfinity Mobile appears to have sent the largest share of its data via hotspots, it’s a smaller share than I expected:5

Tutela data suggests that Xfinity Mobile has already succeeded in offloading over 6% of smartphone data traffic onto its Wi-Fi network – far more than any other network.

Tutela also shares a graph comparing hotspot usage among different carriers:6

Graph of wi-fi usage share among multiple carriers

Other stuff

There were a few other bits of the report that I found especially interesting. In one section, the report’s authors reflect on the fast growth of MVNOs run by cable companies:7

Xfinity Mobile and Spectrum Mobile captured nearly 50% of the postpaid subscriber growth in Q2 2019, and combined added nearly as many postpaid subscribers as host network Verizon.

In another part of the report, Tutela shares a map displaying the most common host network that Google Fi subscribers access. It looks like there are a decent number of areas where Sprint or U.S. Cellular provide the primary host network:8

Why Are Major Carriers’ Websites So Bad?

In my experience, major wireless carriers have terrible websites. It’s hard to figure out all of the plans major carriers offer and the prices of those plans. Finding details about plans’ policies and limitations is often tricky. In contrast, a lot of small, MVNO carriers have easy-to-use websites.

Among the major carriers, I’ve spent the most time using Verizon’s website. While doing things that Verizon suggested I should be able to do online, I’d regularly be served error messages indicating that I should call Verizon’s telephone support.

A recent Reddit thread titled Why is the official Verizon website so bad? touched on the same topic. Commenters indicated that bad websites are par for the course with the major carriers. Here’s the top-voted comment in the thread:1

AT&Ts website and app are far worse. I promise you.

So why are major carriers’ websites so bad? I think part of the explanation is that mobile phone service in the U.S. is a confusopoly. Incompetence doesn’t explain why it’s difficult to find clear descriptions of carriers’ policies and limitations. Carriers make some information hard to find because keeping that information in hard-to-reach areas is in their interests. Carriers often default to showing website visitors a subset of their plans. Visitors often need to search to find prepaid and budget plans. Carriers know that price-sensitive consumers will be more likely to put effort into searching while price-insensitive consumers may spend more than they need to for premium service.

I don’t think my argument that mobile phone service is a confusopoly is sufficient to explain all of the ways in which major carriers websites are bad. It’s hard to see how some of the issues I’ve experienced could serve carriers’ interests. For example, Verizon’s website went down last week. I don’t think the outage was good for Verizon.

Maybe all of the complexity large carriers deal with contributes to their websites being so bad. Subscribers with major carriers are on all sorts of different plans with different policies, features, etc. On the other hand, lots of companies deal with complexity and still have good websites. Financial institutions offer complicated services; their websites seem to work a lot better than major carriers’ websites.

I’m not sure what to think. If other explanations make a lot of sense to you, let me know in the comments.

Why Are Family Plans Cheaper?

Wireless carriers often offer service with a lower price per line for customers on multi-line plans. For example, here’s how Verizon prices its Start Unlimited Plan:1

  • 1 line – $70 per line
  • 2 lines – $60 per line
  • 3 lines – $45 per line
  • 4 lines – $35 per line
  • 5 lines – $30 per line

The cost per line with five users is less than half of the cost per line with only one user. I can think of a few reasonable-seeming explanations for why carriers price their plans this way.

Reduced logistical costs

There may be higher overhead costs per subscriber on single-line plans than on multi-line plans. For example, carriers incur costs when sending bills and processing payments. Even if a multi-line plan has five lines, there is only one bill that needs to be paid each month. Similarly, support costs per line may be lower for multi-line plans. Offering support to an account with five lines probably does not take 5x the effort it takes to offer support to an account with only one line.

Different price sensitivity

Multi-line plans tend to be purchased by families. People may be more price-sensitive when shopping for family plans. Maybe people are often willing to pay top-dollar for an individual (single-line) plan but unwilling to pay top-dollar for service for a whole family.

Looking at it another way, shopping around for deals makes more sense as the price of a service increases. The total cost of a family plan tends to be higher than the total cost of a single-line plan.

Inconsistent use

Not everyone uses their phones in the same way. When my family shared a plan, my sister and I used a fair amount of data. My brother used a little bit of data. My parents barely used any data. On the flip side, I barely used minutes; many of my family members talked on their phones regularly.

When buying a single-line plan, it’s often easy for people to find a plan that’s well-matched to how they use their phone. When family plans require all subscribers to be on the same plan, some people will be forced into plans that are mismatched with their levels of use. I expect it’s common for families to put everyone on an unlimited plan because one or two family members use a lot of data. As a result, lots of light data users end up on multi-line, unlimited plans. In contrast, light data users purchasing single-line plans rarely end up on unlimited plans.

I expect the average person on a single-line, unlimited plan from Verizon uses more data than the average person on a multi-line, unlimited plan from Verizon. Subscribers that use Verizon’s network more heavily contribute more to Verizon’s expenses. As a result, Verizon charges single-line users a higher rate per line.

If everyone in your family uses their phones in about the same way, consider yourself lucky. Your family may be able to get an unusually good deal on wireless service.

VerHIDEzon – Brought To You By T-Mobile

T-Mobile just started a satirical ad campaign criticizing Verizon. T-Mobile’s CEO, John Legere, kicked the campaign off with this tweet:

Tweet from T-Mobile's CEO

The ad campaign criticizes Verizon for its decision to charge a premium for 5G service without publishing a map of areas where 5G service is available. The website for the campaign, VerHIDEzon.com, has some entertaining content:

We believe in charging a premium for 5G, without telling you where you’ll have coverage.
Why do we do this? Because we’re VerHIDEzon, and we do whatever we want…Every day we wake up with one goal in mind: charge our customers as much as possible.


T-Mobile makes a good point. It’s silly for Verizon to charge for 5G service without publishing information that indicates the extent of Verizon’s 5G coverage. Still, I find the campaign kind of odd. Neither company has much 5G coverage at the moment. Almost no one is using 5G-compatible phones yet. It may make business sense for T-Mobile to run the campaign today, but more time will need to pass before 5G has a lot of relevance for typical consumers.

Representation of the concept of a limit

Google Fi’s Unlimited Plan Has Limits

Last month, I published a blog post titled Unlimited Plans At 2G Speeds Are Bogus. I argued that wireless carriers that throttle data speeds to 128Kbps after a threshold amount of data use shouldn’t call their plans “unlimited.” Doing things on the internet at 128Kbps is often frustrating or impossible. Beyond that, imposing a maximum speed implicitly limits the amount of data a subscriber can use in a month.

In a follow-up post, I was critical of Atlice Mobile for labeling a plan as “unlimited” while imposing a bunch of limits that it did not clearly disclose. Google Fi seems to be following in Altice Mobile’s footsteps. Today, Fi Launched a new “unlimited” plan. Subscribers on this plan only get to use 22GB of data at regular speeds:1

If you use more than 15 GB of data in a cycle on the Fi Flexible plan or more than 22 GB in a cycle on the Fi Unlimited plan (less than 1% of individual Fi users as of Jan. 2018), you’ll experience slower speeds (256 kbps) above those respective data thresholds until your next billing cycle begins.
While I expect Fi is accurately reporting that less than 1% of users as of January 2018 exceeded 22GB of use, the statement might mislead people. Until now, Fi didn’t try to entice heavy data users with an option it labeled as an unlimited plan.2

256Kbps is slow

Data at 256Kbps will be more usable than data at 128Kbps, but many online activities will still be impractical. I don’t think continuous video streaming will work even at fairly low resolutions. Many web pages will load extremely slowly. As mentioned earlier, imposing a max speed of 256Kbps does limit the maximum data subscribers can use. Even if a subscriber manages to transfer a full 256 kilobits every single second after using 22GB of regular data, she’ll still have a theoretical limit of about 100GB of data use each month.3

Market pressures

While I haven’t always been a fan of Google Fi’s prices, I have thought of Google Fi as being a company that’s offering wireless service in an unusually transparent and consumer-friendly manner. I’m sad to see Google Fi caving to marketing pressures. That said, I realize the pressures are real. So let me make something clear: most people are not heavy data users; most people do not need unlimited plans. If enough consumers recognize that, there will be less pressure for companies to offer silly, not-really-unlimited plans.