Abstract map of USA

What Happened To Opensignal’s Reach Metric?

Say a country has two cellular networks. Network A offers coverage nearly everywhere. Network B offers a much smaller coverage footprint. You could crowdsource data from ordinary subscribers on the networks and track what proportion of the time users are connected to their networks.

If you compare the availability metrics for both networks, I’m unsure what insights you glean. Conventional crowdsourcing doesn’t involve random samples of people within a country. Even if Network B is crummy and has a small coverage footprint, people who use it will tend to live within its coverage footprint. People living elsewhere will opt for Network A and its larger coverage footprint. It’s a classic case of selection bias.

Even if the people you’re crowdsourcing data from represent a random sample of people within a country, a 95% availability metric wouldn’t indicate that a network covers 95% of the country’s land. People concentrate in certain areas. Although urban areas comprise a small fraction of the US, 80% of people live within them.

Opensignal’s Conundrums

Opensignal is arguably the leader in crowdsourced assessments of networks. To Opensignal’s credit, it acknowledges the limitations of its crowdsourced availability metrics:

Our availability metrics are not a measure of a network’s geographical extent. They won’t tell you whether you are likely to get a signal if you plan to visit a remote rural or nearly uninhabited region.

At some point, Opensignal started publishing another coverage metric called “Reach.” As far as I can tell, Opensignal only used this metric in the US for its 5G assessments.1

Here’s how Opensignal explains Reach:

5G Reach measures how users experience the geographical extent of an operator’s 5G network. It analyzes the average proportion of locations where users were connected to a 5G network out of all the locations those users have visited.

Reach addresses part of my concern with the crowdsourced availability metric. Interestingly, the metric doesn’t appear in the most recent reports on 5G performance in the US. I wonder why.2

Crowd of people

Opensignal & Tutela Join Forces

Earlier this week, Comlinkdata announced that it will acquire Opensignal, a company that collects crowdsourced data about the performance of cellular networks. A few years ago, Comlinkdata acquired Tutela, another company crowdsourcing performance data. It’ll be interesting to see whether Comlinkdata continues to operate Tutela and Opensignal as more-or-less independent brands.

I’ve previously argued that network evaluation involves all sorts of weird dynamics and conflicts of interest. I expect putting Tutela and Opensignal under the same roof will cause a shift in the incentives at play, but I haven’t made up my mind about the implications of that shift.

Trophy

Does T-Mobile Have The Best 5G?

T-Mobile has started bragging about having the best 5G speeds in Opensignal’s latest report. Here’s an excerpt from today’s press release from T-Mobile:

New independent data from Opensignal, based on real world customer usage from millions of device measurements, shows T-Mobile customers now get the fastest 5G download speeds, fastest 5G upload speeds AND a 5G signal more often than anyone else.

I’ve been critical of selection bias issues inherent in Opensignal’s methodology. I continue to think there are serious selection bias issues with Opensignal’s latest 5G metrics. Still, I don’t think my qualms are significant enough to dismiss T-Mobile’s apparent lead in 5G speeds and 5G coverage. T-Mobile is killing it. Here’s another bit from today’s press release:

With the first and largest nationwide 5G network, T-Mobile’s Extended Range 5G covers more than 280 million people across nearly 1.6 million square miles – offering 2.5x more geographic coverage than AT&T and nearly 4x more than Verizon. With Sprint now part of T-Mobile, the Un-carrier is widening its lead, using dedicated spectrum to bring customers with capable devices download speeds of around 300 Mbps and peak speeds up to 1 Gbps. The Un-carrier’s Ultra Capacity 5G already reaches more than 1,000 cities and towns and covers 106 million people.

Early in its 5G rollout, T-Mobile relied on low-frequency spectrum around 600MHz. While this spectrum was great for coverage, it had lousy speed potential. In 2020, T-Mobile put a lot of effort into bragging about how it led the nation in 5G coverage. While the bragging was technically accurate, the whole thing was bullshit in practical terms. 5G delivered with T-Mobile’s low-frequency spectrum was often slower than a typical 4G connection.

Recently, T-Mobile started rolling out large-scale 5G deployments using mid-band spectrum. T-Mobile’s mid-band 5G now covers about a third of Americans. Mid-band 5G actually delivers speeds that are substantially better than consumers are used to with 4G.

Verizon is still crushing the competition in terms of coverage with ultra-fast, millimeter wave 5G. However, Verizon’s achievements with millimeter wave don’t have much value for consumers yet. Even Verizon’s millimeter wave coverage is lackluster, and practical applications for ultra-fast cellular speeds are rare.

While I think T-Mobile legitimately holds the top spot for 5G coverage and average 5G speeds, I also think Verizon will overtake T-Mobile as 5G rollouts reach more mature stages. In my view, the interesting thing to watch will be whether T-Mobile or AT&T ends up with the second-place spot in the 5G competition.1 T-Mobile’s spectrum holdings and financial position may give the network a significant edge over AT&T.

Opensignal’s Report on U.S. 5G Performance – No Big Surprises

Earlier this week, Opensignal released a report on the performance of 5G networks in the United States. Opensignal’s report puts some numbers and data behind two things that were already clear:

  • T-Mobile is destroying the competition in terms of 5G coverage, but T-Mobile’s 5G isn’t very fast
  • Verizon’s 5G is outrageously fast, but the coverage profile is terrible.

Opensignal primarily collects its performance data by crowdsourcing data from tests that run in the background on regular people’s phones. It looks like the company restricted the data underlying this report to include tests run from 5G-compatible phones.

Speeds

Verizon destroyed the competition with an average 5G download speed of 495Mbps. The other major networks in the U.S. had 5G download speeds averaging around 50Mbps. Verizon’s dominance in download speeds is due to the company’s focus on rolling out millimeter wave 5G.

Coverage

Unlike Verizon, T-Mobile has focused on deploying sub-6 5G. This type of 5G is great for covering large areas, but less impressive for delivering high speeds. Unsurprisingly, T-Mobile dominated in terms of 5G availability. According to Opensignal’s data, T-Mobile subscribers were able to access 5G 22.5% of the time. Verizon did about fifty times worse with an availability score of 0.4%.

While 0.4% is low, it’s still a better availability score than I would have predicted for Verizon. I wonder if Opensignal’s crowdsourcing approach might lend Verizon’s availability scores a leg up. If living near a Verizon 5G deployment makes a Verizon customer more likely to purchase a 5G phone, selection bias can creep in and cause Opensignal to overestimate Verizon’s actual 5G availability.

Silly press releases

Following Opensignal’s release of its report, T-Mobile published a press release. The company bragged about the network’s excellent 5G coverage without mentioning that the network got demolished in the download speed results.

Verizon published its own press release bragging about ludicrous download speeds. Verizon’s awful 5G availability score was not mentioned.

Download Speed Experience – 5G Users

Opensignal’s report included a metric called Download Speed Experience – 5G Users. The results for this metric were calculated by looking at users with 5G-compatible phones and tracking their average download speed even at times where they did not have 5G connections. In some sense, this single metric does some accounting for both 5G speeds and 5G availability.

Verizon and AT&T tied for the top spot:
Results graph showing AT&T and Verizon tied for the top spot

The metric is interesting, but I don’t think it quite captures how users will feel about the quality of their download speed experiences. The marginal value of a 10Mbps boost in download speeds that moves a subscriber from 5Mbps to 15Mbps is much greater than the marginal value of a 10Mbps boost that moves a subscriber from 500Mbps to 510Mbps. Collapsing a distribution of download speeds into a single, average download speed masks this reality.

Opensignal’s 2020 U.S. Mobile Performance Report

Today, Opensignal released a new report on the performance of U.S. wireless networks. The report details results on seven different metrics.

Here are the networks that took the top spot for each metric at the national level:

  • Video Experience – Verizon
  • Voice App Experience – T-Mobile/AT&T (draw)
  • Download Speed Experience – AT&T
  • Upload Speed Experience – T-Mobile
  • Latency Experience – AT&T
  • 4G Availability – Verizon
  • 4G Coverage Experience – Verizon

It’s important to interpret these results cautiously due to limitations in Opensignal’s crowdsourcing approach. Since performance data is collected from actual subscribers’ devices, factors not directly related to underlying network quality may impact the organization’s results. For example, if subscribers on a network are unusually likely to use low-end devices or live in rural areas, that will affect the outcome of Opensignal’s analyses. Still, Opensignal’s results are interesting; they’re drawn from a huge data set involving primarily automated performance tests.

Download speed findings

The most notable result in the latest report might be AT&T’s first-place finish on the download speed metric. In the previous Opensignal report, T-Mobile won first place for download speeds, and AT&T took third place. I’ve recently been critical of the methodologies used in some other evaluations that suggested AT&T had the nation’s fastest network. While many of those methodological criticisms still stand, the fact that Opensignal’s arguably more reliable methodology also found AT&T to have the fastest network leads me to believe I was too harsh. I’ll be interested to see whether AT&T also takes the top spot for speeds in RootMetrics’ upcoming report.

New metrics

Two new metrics were introduced in this report: Voice App Experience and 4G Coverage Experience. The Voice App Experience metric assesses the quality of voice calls via apps like Skype and Facebook Messenger. I’m not exactly sure how the metric works, but it looks like all four networks received similar scores. Opensignal deemed all these scores as indicative of “acceptable” quality.

The 4G Coverage Experience metric adds a bit of complexity to the previously existing 4G Availability metric. The coverage metric assesses 4G availability across areas all Opensignal’s users find themselves in, regardless of their network.

Woman making a skeptical face

Opensignal Released a New Report – I’m Skeptical

Opensignal just released a new report on the performance of U.S. wireless networks. The report ranks major U.S. networks in five categories based on crowdsourced data:

  • 4G availability
  • Video experience
  • Download speed experience
  • Upload speed experience
  • Latency experience

Verizon took the top spot for 4G availability and video experience. T-Mobile came out on top for both of the speed metrics. T-Mobile and AT&T shared the top placement for the latency experience metric.

Selection bias

I’ve previously raised concerns about selection bias in Opensignal’s data collection methodology. Opensignal crowdsources data from typical users. Crowdsourcing introduces issues since there are systematic differences between the typical users of different networks. Imagine that Network A has far more extensive coverage in rural areas than Network B. It stands to reason that Network A likely has more subscribers in rural areas than Network B. Lots of attributes of subscribers vary in similar ways between networks. E.g., expensive networks likely have subscribers that are wealthier.

Analyses of crowdsourced data can capture both (a) genuine differences in network performance and (b) differences in how subscribers on each network use their devices. Opensignal’s national results shouldn’t be taken too seriously unless Opensignal can make a compelling argument that either (a) its methodology doesn’t lead to serious selection bias or (b) it’s able to adequately adjust for the bias.

Speed metrics

Opensignal ranks carriers based on average download and upload speeds. In my opinion, average speeds are overrated. The portion of time where speeds are good enough is much more important than the average speed a service offers.

Opensignal’s average download speed results are awfully similar between carriers:

  • Verizon – 22.9 Mbps
  • T-Mobile – 23.6 Mbps
  • AT&T – 22.5 Mbps
  • Sprint – 19.2 Mbps

Service at any of those speeds would be sufficient for almost any activities people typically use their phones for. Without information about how often speeds were especially low on each network, it’s hard to come to conclusions about differences in the actual experience on each network.

Network Evaluation Should Be Transparent

Several third-party firms collect data on the performance of U.S. wireless networks. Over the last few months, I’ve tried to dig deeply into several of these firms’ methodologies. In every case, I’ve found the public-facing information to be inadequate. I’ve also been unsuccessful when reaching out to some of the firms for additional information.

It’s my impression that evaluation firms generally make most of their money by selling data access to network operators, analysts, and other entities that are not end consumers. If this was all these companies did with their data, I would understand the lack of transparency. However, most of these companies publish consumer-facing content. Often this takes the form of awards granted to network operators that do well in evaluations. It looks like network operators regularly pay third-party evaluators for permission to advertise the receipt of awards. I wish financial arrangements between evaluators and award winners were a matter of public record, but that’s a topic for another day. Today, I’m focusing on the lack of transparency around evaluation methodologies.

RootMetrics collects data on several different aspects of network performance and aggregates that data to form overall scores for each major network. How exactly does RootMetrics do that aggregation?

The results are converted into scores using a proprietary algorithm.1

I’ve previously written about how difficult it is to combine data on many aspects of a product or service to arrive at a single, overall score. Beyond that, there’s good evidence that different analysts working in good faith with the same raw data often make different analytical choices that lead to substantive differences in the results of their analyses. I’m not going take it on faith that RootMetrics’ proprietary algorithm aggregates data in a highly-defensible manner. No one else should either.

Opensignal had a long history of giving most of its performance awards to T-Mobile.2 Earlier this year, the trend was broken when Verizon took Opensignal’s awards in most categories.3 It’s not clear why Verizon suddenly became a big winner. The abrupt change strikes me as more likely to have been driven by a change in methodology than a genuine change in the performance of networks relative to one another. Since little is published about Opensignal’s methodology, I can’t confirm or disconfirm my speculation. In Opensignal’s case, questions about methodology are not trivial. There’s good reason to be concerned about possible selection bias in Opensignal’s analyses. Opensignal’s Analytics Charter states:4

Our analytics are designed to ensure that each user has an equal impact on the results, and that only real users are counted: ‘one user, one vote’.

Carriers will differ in the proportion of their subscribers that live in rural areas versus densely-populated areas. If the excerpt from the analytics charter is taken literally, it may suggest that Opensignal does not control for differences in subscribers’ geography or demographics. That could explain why T-Mobile has managed to win so many Opensignal awards when T-Mobile obviously does not have the best-performing network at the national level.

Carriers advertise awards from evaluators because third-parties are perceived to be credible. The public deserves to have enough information to assess whether third-party evaluators merit that credibility.

Lies, Damned Lies, and AT&T’s 5GE

There are three kinds of lies: lies, damned lies, and statistics.Benjamin Disraeli*

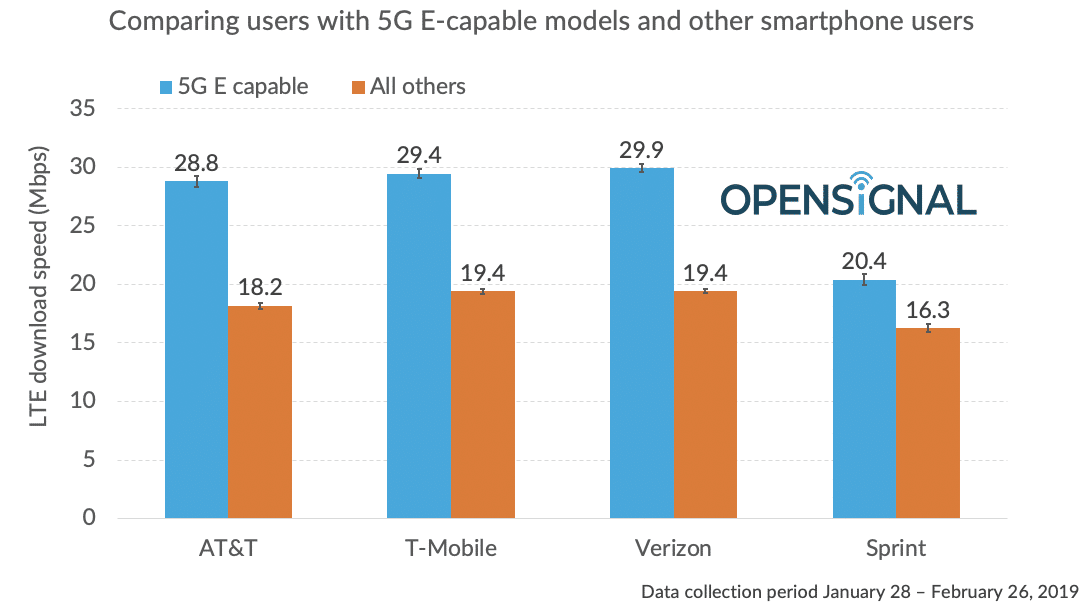
Fortunately, the sentiment behind this quote isn’t always accurate. Sometimes statistics can reveal lies. AT&T has recently taken a lot of heat for misleadingly branding advanced 4G networks as “5GE.” Ian Fogg at Opensignal published a post where he draws on Opensignal’s data to assess how AT&T’s 5GE-enabled phones perform compared to similar phones on other carriers. The results:1

In response to AT&T’s misleading branding, Verizon launched a video advertisement showing a head-to-head speed comparison between Verizon’s network and AT&T’s 5GE network.

In that video, Verizon’s 4G LTE network comes out with a download speed near 120Mbps while AT&T’s 5GE network came out around 40Mbps. That, of course, seems funny given the Opensignal data suggesting the networks deliver similar speeds on average.

A portion of the Verizon video—not long enough to show the final results—showed up in a Twitter ad. That ad led to a Twitter exchange between myself; Light Reading’s editorial director, Mike Dano; and Verizon’s PR manager, Steven Van Dinter. Dinter explained that Verizon chose to film in a public spot where AT&T’s 5GE symbol was very strong. I take Dinter’s word that there wasn’t foul play or blatant manipulation, but it is funny to see Verizon fighting misleading branding from AT&T with a misleading ad of its own.

Average Download Speed Is Overrated

I’ve started looking into the methodologies used by entities that collect cell phone network performance data. I keep seeing an emphasis on average (or median) download and upload speeds when data-service quality is discussed.

  • Opensignal bases it’s data-experience rankings exclusively on download and upload speeds.1
  • Tom’s Guide appears to account for data-quality using average download and possibly upload speeds.2
  • RootMetrics doesn’t explicitly disclose how it arrives at final data-performance scores, but emphasis is placed on median upload and download speeds.3

It’s easy to understand what average and median speeds represent. Unfortunately, these metrics fail to capture something essential—variance in speeds.

For example, OpenSignal’s latest report for U.S. networks shows that Verizon has the fastest average download speed of 31 Mbps in the Chicago area. AT&T’s average download speed is only 22 Mbps in the same area. Both those speeds are easily fast enough for typical activities on a phone. At 22 Mbps per second, I could stream video, listen to music, or browse the internet seamlessly. For the rare occasion where I download a 100MB file, Verizon’s network at the average speed would beat AT&T’s by about 10.6 seconds.4 Not a big deal for something I do maybe once a month.

On the other hand, variance in download speeds can matter quite a lot. If I have 31 Mbps speeds on average, but I occasionally have sub-1 Mbps speeds, it may sometimes be annoying or impossible to use my phone for browsing and streaming. Periodically having 100+ Mbps speeds would not make up for the inconvenience of sometimes having low speeds. I’d happily accept a modest decrease in average speeds in exchange for a modest decrease in variance.5