
Opensignal’s Methodology
Data collection
Opensignal crowdsources data on wireless networks’ performance via tests that run in the background on wireless devices.1 These tests take place on devices running apps owned by Opensignal and apps run by developers that partner with Opensignal.2 At the moment, I don’t have a firm understanding of the in-the-weeds details of the data collection process.3
Potential selection bias
Since Opensignal’s data is crowdsourced, it may be vulnerable to selection bias. Users of Network A may be different, on average, from users on Network B. For example, a greater proportion of subscribers on low-cost networks may use low-cost devices than subscribers on high-cost networks. Differences in measured performance on low-cost and high-cost networks could be due to either (a) genuine differences in network capabilities or (b) differences in the capabilities of the devices subscribers use to access each network.
I’m particularly concerned about selection bias that could be the result of differences in subscribers’ geographic locations. Geographic selection bias may not be a big deal when looking at Opensignal’s data within a small region. However, I’m extremely concerned about selection bias in Opensignal’s nationwide assessments of network quality.
Roaming
Opensignal appears to attribute data collected while users are roaming to the users’ home networks.4 Caution should be exercised when using Opensignal’s data to assess the performance of mobile virtual network operators (MVNOs) that resell access to Big Four networks (AT&T, Verizon, Sprint, and T-Mobile). MVNO subscribers will not necessarily have the same roaming access as direct subscribers to the Big Four carriers.
MVNOs excluded
Opensignal does not attribute data collected from MVNO subscribers to their carriers’ host operators.5
Results aggregation and reporting
Online reports
On its website, Opensignal publishes national and regional reports on network quality. In the January 2019 report covering the U.S., regional results were available for 57 metro areas.6 These reports are easy to make sense of and present metrics related to download speed, upload speed, latency, and video quality. Overall, I find Opensignal’s reports much easier to interpret than RootMetrics’ similar RootScore reports.
Since Opensignal’s reports present aggregated data from decent-sized areas, the reports may mask variation in quality that exists at finely-grained geographic levels (in addition to capturing the effect of previously mentioned, geographic selection bias). Fortunately, Opensignal lets consumers access more-finely grained data for free via an app.
Phone app
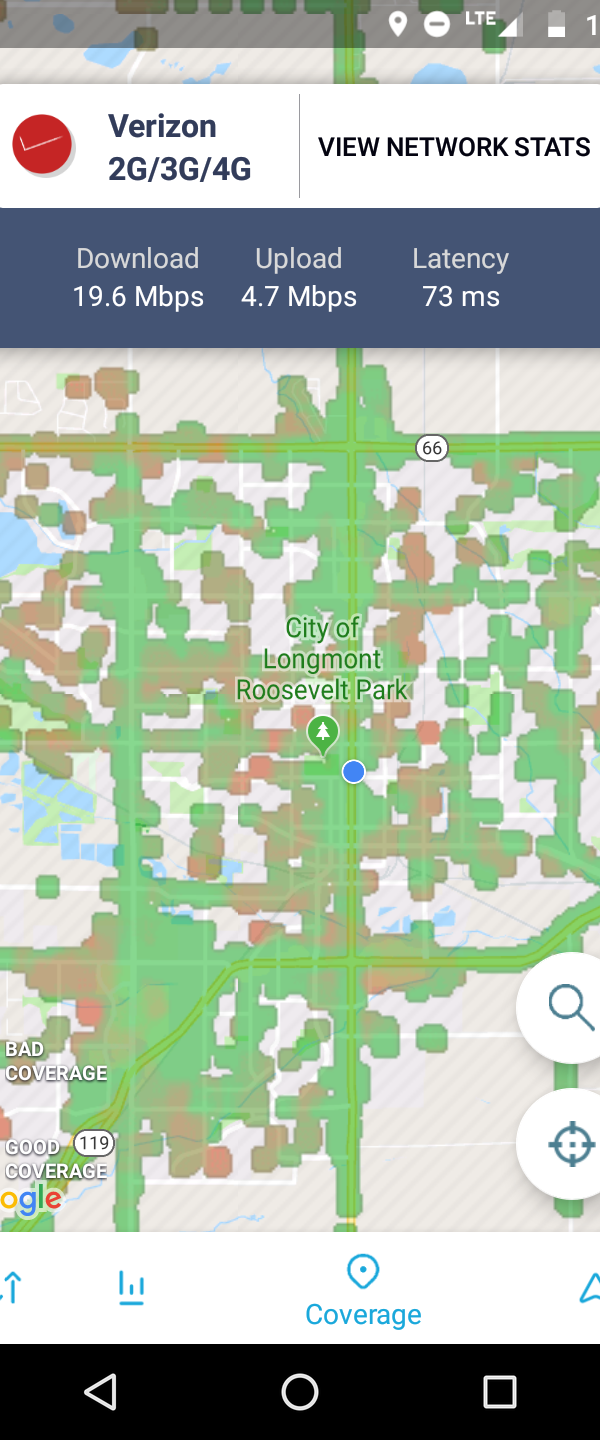
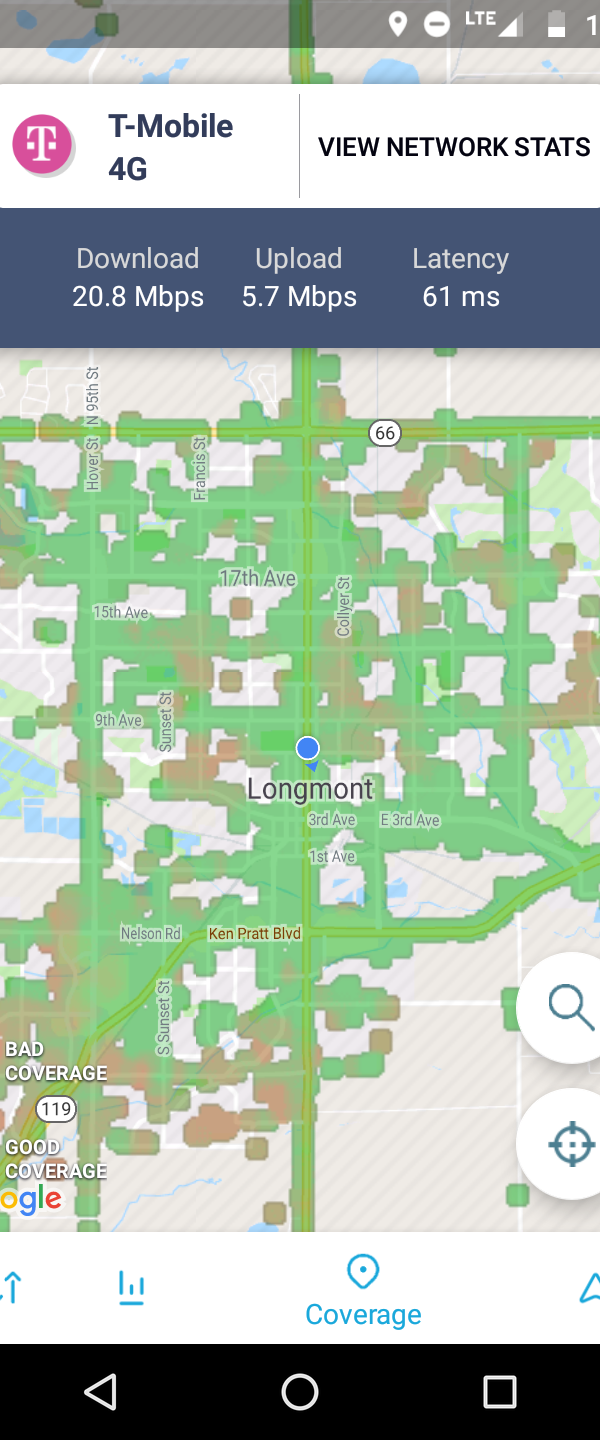
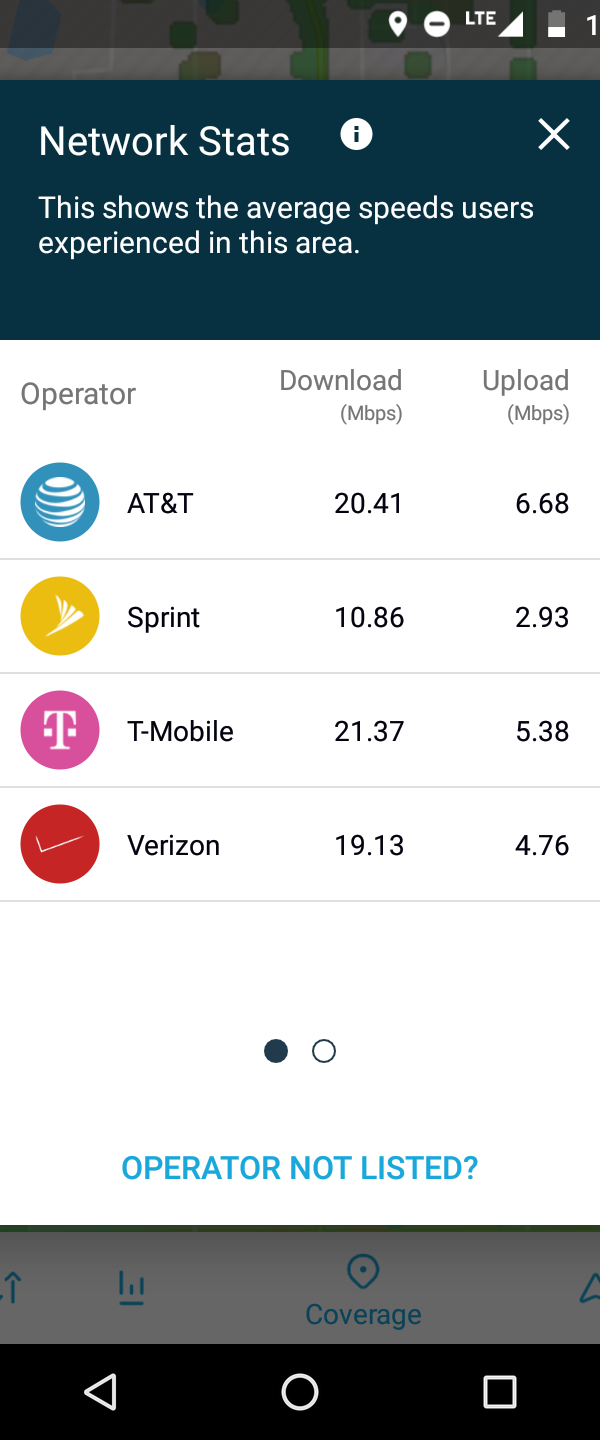
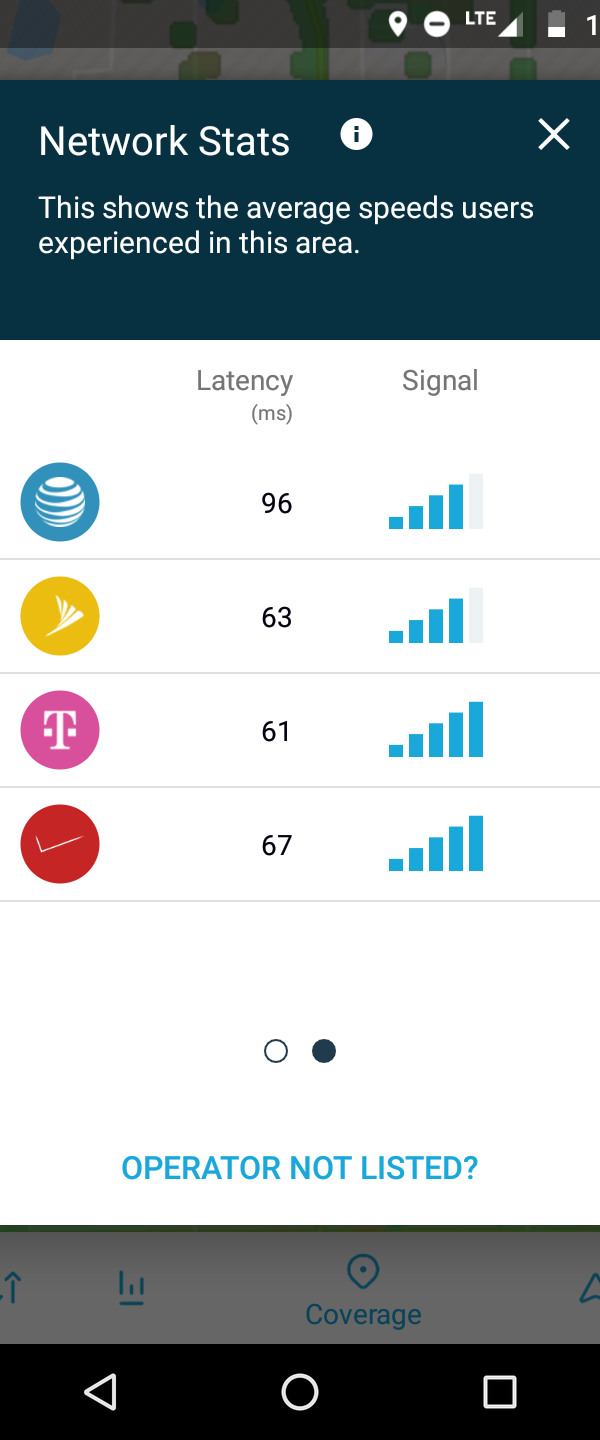
Opensignal offers an app where users can run speed tests, contribute to Opensignal’s data collection, view details about cell towers, and explore maps displaying Opensignal’s crowdsourced data; I find this final feature to be especially useful. While I think there are ways the data exploration feature could be improved, it’s already extremely helpful for assessing network quality. Here are a few screenshots from the app:
Open questions
- How much of Opensignal’s data comes from apps it owns versus apps it partners with?
- Is any of the performance data Opensignal uses (a) not crowdsourced or (b) collected via manual tests?
- What is the process Opensignal uses to select app partners?
- Does Opensignal engage in any kind of data cleaning that might be seen as unexpected or unconventional?
- Does Opensignal receive compensation from entities that advertise results of Opensignal’s testing?
- Are there standard file sizes used in U.S. download and upload speed tests?
- Does Opensignal consistently receive data on occasions where tests fail (e.g, when no signal is available)?
- What impact do failed tests have on the metrics Opensignal reports?
- What prompts a test to run? Do tests occur at regular time intervals?
- Does Opensignal always know when a device is operating on an MVNO rather than a host operator?
- Does Opensignal ever try to control for selection bias?
- Why was there such a drastic change in which networks won awards in the mid-2018 report compared to the early 2019 report? Was the difference primarily driven by differences in the raw data collected or changes in methodology?
Nitpicking
- “Commercial relationships never influence our reporting.”7 I’m all for attempts to minimize bias, but I don’t think this statement is true as stated (related blog post).
- “This step change from testing performance to measuring experience was revolutionary and yet so simple. It was the difference between conducting controlled laboratory tests and recording real events as they happened in their natural environment. Scientists have long held that the latter yields far more accurate findings. We could not agree more.”8 There are lots of situations where I would find controlled laboratory tests more useful than trials in uncontrolled, natural environments.
Footnotes
- “We collect the vast majority of our data via automated tests that run in the background, enabling us to report on users’ real-world mobile experience at the largest scale and frequency in the industry.”
From Opensignal’s Understanding mobile network experience: What do Opensignal’s metrics mean? (archived here). Accessed 4/5/2019. - A TechCrunch article from March 2018 stated the following (Branden Gill is the CEO of Opensignal):
“Gill declined to name specific app partners, but said that the list is in the tens, not hundreds, of apps; and that they cover a broad range of areas like gaming, social networking and productivity in order to get ‘as average as possible’ range of mobile uses as possible to find the most accurate, real-world mobile data speeds.” - See the “Open questions” section for details about aspects of Opensignal’s data collection that I’d like to know more about.
- On 4/16/2019, Opensignal stated the following on its Analytics Charter web page (archived here):
“Measurements generated by national roamers are attributed to the user’s home operator as that is part of their network experience.” - On 4/16/2019, Opensignal stated the following on its Analytics Charter web page (archived here):
“To ensure that our data truly represents the experience of an operator’s own customers we exclude measurements generated by inbound and outbound international roamers and MVNOs as they may be subject to different service agreements.” - “In our regional analysis, we examined four of our primary metrics in 57 different cities in the U.S.”
From Opensignal’s January 2019 report (archived here). - From Opensignal’s Manifesto as of 4/5/2019.
- From Opensignal’s About us page as of 4/5/2019.