While RootMetrics describes its approach as “transparent,”1 I have found the public information to be far from comprehensive. RootMetrics’ methodology web page leaves me with open questions, and I did not receive a response when I reached out for additional information.
Data collection methodology
RootMetrics collects data on the performance of major networks using off-the-shelf, Android phones. As I understand it, RootMetrics aims to conduct its tests with the best commercially available phones from each carrier.2 Network performance data is collected while test devices engage in common activities like web browsing, calling, and texting.3 My impression is that RootMetrics primarily engages in drive-testing—dragging the phones along U.S. roadways while collecting performance data.4 RootMetrics also has an app anyone can install to contribute to crowdsourced data. RootMetrics’ methodology page indicates that the company sometimes engages in testing indoors and at event venues.5
Unfortunately, RootMetrics is frustratingly vague about how different parts of its testing factor into its final results. The following statement is found on the methodology page:
“After the tests are evaluated for accuracy, the results are converted into scores using a proprietary algorithm.”
As someone who has been involved in creating ranking algorithms for use in third-party evaluations, I doubt the algorithm is proprietary because it’s a clever trade secret. More likely, revealing the algorithm could reduce people’s faith in RootMetrics. Creating good, broad-purpose ranking algorithms that aggregate scores from multiple categories is often infeasible.
Roaming
RootMetrics claims to measure performance with roaming enabled.6 This is probably a good thing for consumers using RootMetrics’ reports to assess the performance of services purchased directly from one of the Big Four operators (AT&T, Verizon, Sprint, and T-Mobile). However, this may complicate assessments of mobile virtual network operators that resell access to Big Four networks but generally do not have the same roaming agreements.
Reduced risk of selection bias
Since users of one network probably differ on average from users on other networks, it’s possible that crowdsourced data may capture differences between users and devices rather than true differences in network performance. I believe RootMetrics mostly avoids these issues in its drive tests. First, the drive tests bring phones from each network to the same places. This alleviates most of my concerns about selection bias coming from geographic differences. Additionally, the drive tests make use of high-end devices from all carriers. This makes me less concerned that low-cost carriers are at a disadvantage because their networks are disproportionately accessed via old or low-cost devices.7
Aggregation and results reporting
RootScore Reports
RootMetrics shares RootScore Reports based on aggregated data at the metro, state, and national levels. Below is a snapshot of a RootScore Report for Denver.
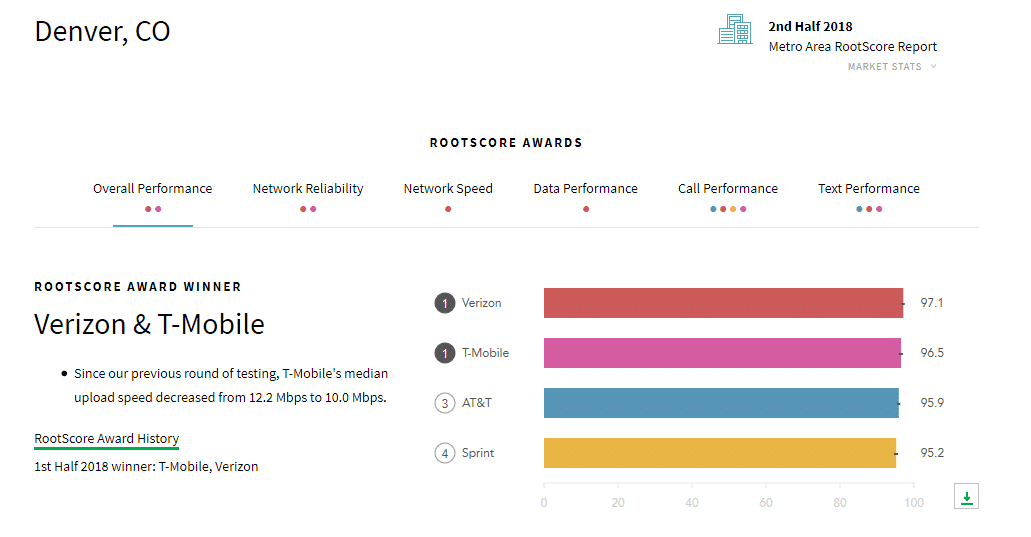
The reports are visually appealing, and it’s easy to navigate between categories. That said, it’s difficult to understand the implications of the reports. What should be made of the scores on the 0-100 scale? RootMetrics doesn’t clearly explain the unit they’ve created.8 Even scores for specific categories use the mysterious 0-100 scale.
RootMetrics sometimes declares ties when scores are slightly different but very close. However, it’s not clear what ties mean. I expect it means something like “after using statistical methods we don’t publicly disclose, we determined that we couldn’t reject the null hypothesis of no difference in performance scores at α=0.05.” That may mean something very different from “we called this a tie because we don’t think the typical consumer would perceive a difference in performance between these networks.” I expect most people looking at RootScore reports will have an interpretation closer to the latter.
RootMetrics app
RootMetrics offers a free app that individual can use to explore and/or contribute to RootMetrics’ performance data. When exploring data, users can select the carrier they’re interested in and then choose one of three map layers: call performance, fastest speed found, or best technology found. The map is split into small hexagonal regions. Any single region can be selected to view information about performance within the region and the number of data points collected in the region. Within the data-performance layer, it’s possible to view average download and upload speeds measured in a given region.
Nitpicking
- RootMetrics claims objectivity.9 I find that frustrating since RootMetrics likely receives money from carriers.10
- RootMetrics claims to place its assessments in “easy-to-understand terms.”11 I’m unusually knowledgeable about wireless networks and devices, and I still don’t feel like I have a good grasp of what RootMetrics’ results mean.
- The RootMetrics app layer for data speeds shows the fastest speed measured in any region. I feel like the average or median speed might be more meaningful.
Open questions
- Why doesn’t RootMetrics make more information about its methodology publicly available?
- What is the relative importance of drive-test results, crowd-sourced data, and other stuff to the final results?
- What kind of financial arrangements does RootMetrics have with network operators?
- What statistical tests and significance levels is RootMetrics using to define results as statistically different or statistically indistinguishable?
- What is the “standard competition-ranking algorithm” RootMetrics uses?
- What devices were used for each carrier in the most recent round of testing?
If you work for RootMetrics and can answer any of these questions, please reach out.
Footnotes
- “Our transparent, consumer-focused approach to evaluating network performance has changed the game. Independent with our methodology, comprehensive in our testing, and accurate with our results, we provide real-world insights that can help improve your daily mobile experience.”
Emphasis mine. From RootMetrics’ methodology web page (archived here). Accessed 3/28/2019. - “RootMetrics benchmarks device models to determine the best commercially available phone model from each network in order to capture the best possible user experience for data, call, and text usage on each particular network. Benchmarking models before testing also helps remove limitations that can be caused by specific model/network interactions.”
From RootMetrics’ methodology web page (archived here). Accessed 3/28/2019. - “We measure network reliability and speed performance across the activities that consumers use their smartphones for on a daily basis, like checking email, browsing webpages, using apps, making calls, and sending texts.”
From RootMetrics’ methodology web page (archived here). Accessed 3/28/2019. - I found this CNET article about RootMetrics’ drive testing interesting and entertaining.
- Two excerpts from RootMetrics’ methodology page as of 3/28/2019:
- “We measure performance indoors and while driving across multiple spaces of a consumer’s mobile life.”
- “When official boundaries are not available (for example, in transit stations or event venues), we measure network performance in densely populated areas where consumers often use their smartphones.”
- “We measure performance with roaming available to mirror a consumer’s experience.”
From RootMetrics’ methodology web page as of 3/28/2019 (archived here). - RootMetrics may still be subject to serious selection bias for the portion of data it crowdsources. It’s also possible that there are non-trivial differences between the capabilities of the high-end devices RootMetrics uses to test each carrier’s performance.
- RootMetrics’ methodology web page as of 3/28/2019 offered an explanation that I didn’t find very helpful:
“Using an educational analogy, think of RootScores like you would a final grade in a semester-long course: scores approaching the upper limit (100) indicate extraordinary performance, like receiving an ‘A’ grade at the end of the semester. Scores approaching the lower limit (0) represent network performance that would be clearly unacceptable to everyday consumer usage, similar to receiving a poor grade at the end of the semester.” - “Providing objective, accurate, and unbiased assessments of performance in helpful and easy-to-understand terms.”
From RootMetrics’ methodology web page (archived here). Accessed 3/28/2019. - RootMetrics sells services to network operators, and I expect (but cannot confirm) that network operators must pay to advertise RootMetrics’ results.
- See the excerpt in the previous footnote.
