

Beware of Scoring Systems
When a third-party evaluator uses a formal scoring system or rubric, it’s a mistake to assume that the evaluator is necessarily being objective, rigorous, or thoughtful about its methodology.
I’ll use Forbes’ college rankings to illustrate.
Forbes argues that most college rankings (e.g., U.S. News) fail to focus on what “students care about most.” Forbes’ rankings are based on what it calls “outputs” (e.g., salaries after graduation) rather than “inputs” (e.g., acceptance rates or SAT scores of admitted applicants).1
Colleges are ranked based on weighted scores in five categories, illustrated in this infographic from Forbes:2
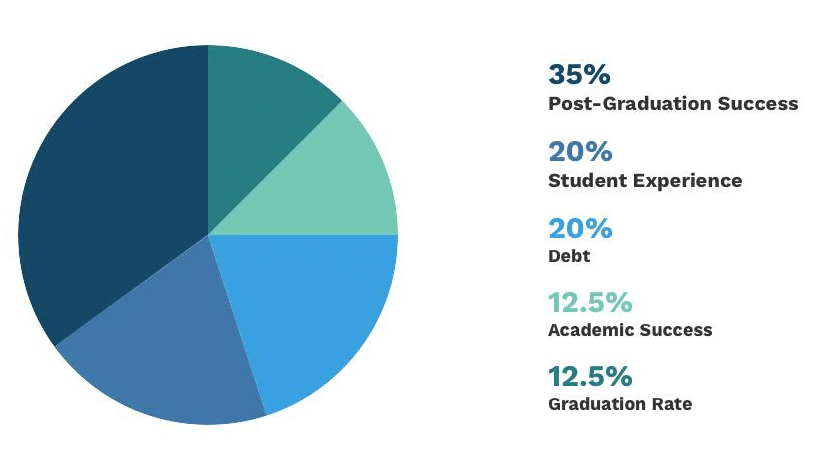
This methodology requires drawing on data to create scores for each category. That doesn’t mean the methodology is good (or unbiased).
Some students are masochists who care almost exclusively about academics. Others barely care about academics and are more interested in the social experiences they’ll have.
Trying to collapse all aspects of the college experience into a single metric is silly—as is the case for most other products, services, and experiences. If I created a rubric to rank foods based on a weighted average of tastiness, nutritional value, and cost, most people would rightfully ignore the results of my evaluation. Sometimes people want salad. Sometimes they want ice cream.
To be clear, my point isn’t that Forbes’ list is totally useless—just that it’s practically useless. My food rubric would come out giving salads a better score than rotten steak. That’s the correct conclusion, but it’s an obvious one. No one needed my help to figure that out. Ranking systems are only useful if they can help people make good decisions when they’re uncertain about their options.
Where do the weights for each category even come from? Forbes doesn’t explain.
Choices like what weights to use are sometimes called researcher degrees of freedom. The choice of what set of weights to use is important to the final results, but an alternative set of reasonable weights could have been used.
When researchers have lots of degrees of freedom, it’s advisable to be cautious about accepting the results of their analyses. It’s possible for researchers to select a methodology that gives one result while other defensible methodologies could have given different results. (See the paper Many Analysts, One Data Set: Making Transparent How Variations in Analytic Choices Affect Results for an excellent demonstration of this phenomenon.)
Creating scores for each category introduces additional researcher degrees of freedom into Forbes’ analysis. Should 4-year or 6-year graduation rate be used? What data sources should be drawn on? Should debt be assessed based on raw debt sizes or loan default rates? None of these questions have clear-cut answers.
Additional issues show up in the methods used to create category-level scores.
A college ranking method could assess any one of many possible questions. For example:
- How impressive is the typical student who attends a given school?
- How valuable will a given school be for the typical student who attends?
- How valuable will a school be for a given student if she attends?
It’s important which question is being answered. Depending on the question, selection bias may become an issue. Kids who go to Harvard would probably end up as smart high-achievers even if they went to a different school. If you’re trying to figure out how much attending Harvard benefits students, it’s important to account for students’ aptitudes before entering. Initial aptitudes will be less important if you’re only trying to assess how prestigious Harvard is.
Forbes’ methodological choices suggest it doesn’t have a clear sense of what question its rankings are intended to answer.

Alumni salaries get 20% of the overall weight.3 This suggests that Forbes is measuring something like the prestige of graduates (rather than the value added from attending a school).4
Forbes also places a lot of weight on the number of impressive awards received by graduates and faculty members.5 This again suggests that Forbes is measuring prestige rather than value added.
When coming up with scores for the debt category, Forbes considers default rates and the average level of federal student debt for each student.6 This suggests Forbes is assessing how a given school affects the typical student that chooses to attend that school. Selection bias is introduced. The typical level of student debt is not just a function of a college’s price and financial aid. It also matters how wealthy students who attend are. Colleges that attract students with rich families will tend to do well in this category.
Forbes switches to assessing something else in the graduation rates category. Graduation rates for Pell Grant recipients receive extra weight. Forbes explains:
Forbes doubles down on its initial error. First, Forbes makes the mistake of aggregating a lot of different aspects of college life into a single metric. Next, Forbes makes a similar mistake by mashing together several different purposes college rankings could serve.
Many evaluators using scoring systems with multiple categories handle the aggregation from category scores to overall scores poorly.8 Forbes’ methodology web page doesn’t explain how Forbes handled this process, so I reached out asking if it would be possible to see the math behind the rankings. Forbes responded telling me that although most of the raw data is public, the exact process used to churn out the rankings is proprietary. Bummer.
Why does Forbes produce such a useless list? It might be that Forbes or its audience doesn’t recognize how silly the list is. However, I think a more sinister explanation is plausible. Forbes has a web page where schools can request to license a logo showing the Forbes endorsement. I’ve blogged before about how third-party evaluation can involve conflicts of interest and lead to situations where everything under the sun gets an endorsement from at least one evaluator. Is it possible that Forbes publishes a list using an atypical methodology because that list will lead to licensing agreements with schools that don’t get good ratings from better-known evaluators?
I reached out to the licensing contact at Forbes with a few questions. One was whether any details could be shared about the typical financial arrangement between Forbes and colleges licensing the endorsement logo. My first email received a response, but the question about financial arrangements was not addressed. My follow-up email did not get a response.

While most students probably don’t care about how many Nobel Prizes graduates have won, measures of prestige work as pretty good proxies for one another. Schools with lots of prize-winning graduates probably have smart faculty and high-earning graduates. Accordingly, it’s possible to come up with a reasonable, rough ranking of colleges based on prestige.
While Forbes correctly recognizes that students care about things other than prestige, it fails to provide a useful resource about the non-prestige aspects of colleges.
The old College Prowler website did what Forbes couldn’t. On that site, students rated different aspects of schools. Each school had a “report card” displaying its rating in diverse categories like “academics,” “safety,” and “girls.” You could even dive into sub-categories. There were separate scores for how hot guys at a school were and how creative they were.9
Forbes’ college rankings were the first college rankings I looked into in depth. While writing this post, I realized that rankings published by U.S. News & World Report and Wall Street Journal/Times Higher Education both use weighted scoring systems and have a lot of the same methodological issues.
To its credit, Forbes is less obnoxious and heavy-handed than U.S. News. In the materials I’ve seen, Forbes doesn’t make unreasonable claims about being unbiased or exclusively data-driven. This is in sharp contrast to U.S. News & World Report. Here’s an excerpt from the U.S. News website under the heading “How the Methodology Works:”
The rankings formula uses exclusively statistical quantitative and qualitative measures that education experts have proposed as reliable indicators of academic quality. To calculate the overall rank for each school within each category, up to 16 metrics of academic excellence below are assigned weights that reflect U.S. News’ researched judgment about how much they matter.10
As a general rule, I suggest running like hell anytime someone says they’re objective because they rely on data.
U.S. News’ dogmatic insistence that there’s a clear dichotomy separating useful data from unscientific, subjective data is misguided. The excerpt also contradicts itself. “Hard objective data alone” do not determine the schools’ ranks. Like Forbes, U.S. News uses category weights. Weights “reflect U.S. News’ researched judgment about how much they matter.” Researched judgments are absolutely not hard data.
It’s good to be skeptical of third-party evaluations that are based on evaluators’ whims or opinions. Caution is especially important when those opinions come from an evaluator who is not an expert about the products or services being considered. However, skepticism should still be exercised when evaluation methodologies are data-heavy and math-intensive.
Coming up with scoring systems that look rigorous is easy. Designing good scoring systems is hard.
Footnotes
- “Forbes’ list of 650 top colleges aims to measure what we believe students care about most. Where will a college steer them in their life after graduation? How likely are they to find success in their chosen field, to earn enough money to pay their student debt, to win accolades like Pulitzer Prizes and Fulbright scholarships, to become leaders in private and public life? How effectively does their school support them so they can graduate within four or six years and join the workforce?…The Forbes list is notable also for the things it doesn’t measure, like SAT scores and acceptance rates, statistics we call ‘inputs.’ We think students are more interested in ‘outputs.’”
From Top Colleges | Forbes (archived copy). Accessed 1/29/2019. - Image from https://www.forbes.com/top-colleges/. Accessed 1/30/2019.
- “Alumni Salary (20%)
To calculate a school’s salary score, we considered four data points: the school’s early career earnings (1-4 years after graduation) from PayScale, mid-career earnings (10-plus years) from PayScale, and the earnings of federal financial aid recipients six (If you’re going to use numerals for 1-4 and 10, you might as well use 6 here instead of spelling it out) years and 10 years after starting college from College Scorecard.Because paying for college is a long-term investment, early career earnings accounted for only a third of our salary score, and later earnings two thirds. PayScale’s data made up 85% of the salary score and College Scorecard the remaining 15%.”
From Top Colleges 2018: The Methodology | Forbes (archived copy). Accessed 1/30/2019. - This methodological choice also introduces potential issues. Schools with large engineering programs will tend to have better salary scores than schools with large art programs. Is that desirable?
- “American Leaders List (15%)
Along with alumni salary, we measure graduates’ success using a data set we compile ourselves, The American Leaders List, is a roster thousands of successful people and their alma maters. We use FORBES databases including the Forbes 400, the Richest Self-Made Women list, the Most Powerful Women list and 30 Under 30. We also count current leaders in public service: U.S. Supreme Court Justices, the President and his Cabinet, members of the U.S. Congress and state governors. In addition, we count winners of the following awards over the last one-to-four years based on the number of recipients for each: MacArthur Fellowship, Nobel Prize, Breakthrough Prize, Lasker Prize, Fields Prize, Academy Awards, Oscars, Tony’s, NAACP Awards, Guggenheim Fellowship, major sport all-stars, Presidential Medals and Pulitzer Prizes. We blended schools’ raw numbers of alumni leaders and its number of leaders adjusted for its number of undergraduates.”“Academic Success (12.5%)
To further measure graduates’ success, we looked at academic achievements. We drew half of this score, 6.25% of our total score, by counting the number of academic awards won by alumni at each school for the past one-to-four years, depending on the number of recipients per year for each. We counted the Fulbright, Truman, Goldwater, Gates, Cambridge and Rhodes Scholarships and weighed them as a percentage of the undergraduate student body.”
From Top Colleges 2018: The Methodology | Forbes (archived copy). Accessed 1/30/2019. - “Debt (20%)
We drew all of our debt data from College Scorecard. We got half of our debt score by multiplying the average federal student loan debt per borrower at each school by the percentage of students at the school who took out federal loans. The other half of our debt score came from two-year and three-year federal student loan default rates.”
From Top Colleges 2018: The Methodology | Forbes (archived copy). Accessed 1/30/2019. - “Graduation Rate (12.5%)
We gave credit to schools that motivate, guide and support students to graduate in a timely manner, saving on tuition and getting into the workforce as soon as possible. We divided our graduation rate calculation into three pieces. The largest is four-year graduation rate, which accounted for 7.5% of our total score. We used data from IPEDS and averaged the rate for the most recent three years. We used the same source and methodology to calculate six-year graduation rates, which counted for 2.5% of our overall score. And we use IPEDS data and the same methodology to count the graduation rates for Pell grant recipients, which accounted for 2.5% of our overall score. Pell grants go to economically disadvantaged students, and we believe schools deserve credit for supporting these students.”
From Top Colleges 2018: The Methodology | Forbes (archived copy). Accessed 1/30/2019. - For example, HostingFacts ranks web hosts based on data it collects in a handful of categories. It makes a big show of being data-driven, but it does silly things to aggregate data into overall scores. In each category, providers are ranked. The best provider gets a category-score of 100. For each position down in the rankings, providers take a 3-point hit. A host with a response time of 0.377 seconds gets 3 points more than a host with a 0.385 second response time (a 2% difference). The same 3-point difference shows up between a host with a 1.511-second response time and a host with a 5.679-second response time (a 276% difference).
Numbers are based on HostingFact’s rankings spreadsheet as of 1/30/2019.
- College Prowler has now rebranded as Niche.com. The new Niche.com site seems to be more professional, more focused on aggregation of category scores, and less useful. Oh well.
- From How U.S. News Calculated the 2019 Best Colleges Rankings (archived copy). Accessed 1/30/2019.