A red flag

Service Outage At Visible

Verizon’s flanker brand Visible has had a rough time the past few weeks. First, a security issue caused trouble for a large number of subscribers earlier this month. Then yesterday, reports of a service outage started to surface.

Several Reddit posts and dozens of comments mentioned the outage. I’m not sure how much of Visible’s subscriber base was affected.1 The issue was widespread enough for Visible to acknowledge the issue on Twitter:


Reports suggest the outage only lasted a few hours. Shortly after sharing its initial tweet, Visible noted that the outage was resolved:

I haven’t heard anything about the underlying cause of the outage.

RootMetrics’ Early 2020 Report

Earlier this week, RootMetrics released its report on cellular networks’ performance in the U.S. in the first half of 2020. The most recent round of RootMetrics’ testing got screwed up by the pandemic, but the company did its best to publish something that followed the structure of its usual reports.

While I continue to think RootMetrics has the best methodology of any network evaluator, I’m not going to discuss the latest results in detail. For the most part, the results were as expected and similar to what RootMetrics found in its previous round of testing.

Highlights

As usual, Verizon was the big winner:

Verizon continued its run of excellence in our national testing, winning or sharing six out of seven awards.

AT&T showed solid performance and easily took the second spot for overall performance. AT&T managed to beat Verizon on RootMetrics’ speed score.

While Sprint is gradually disappearing, RootMetrics included the in its testing. Oddly enough, Sprint’s overall score beat T-Mobile’s score.

PCMag Releases 2020 Cellular Performance Report

PCMag just released its 2020 report on the performance of cellular networks.

  • Verizon took the top spot for overall performance.
  • AT&T came in a close second.
  • T-Mobile came in third place but led in 5G availability.

Differences from previous years’ tests

Due to logistical issues from the pandemic, PCMag altered its methodology:

Traditionally, we’d tour each city and then test rural areas between cities before moving on to the next one. But that involves flights, rental cars, and hotels, none of which we felt safe using this year. So we hired roughly two dozen drivers to each test their own cities, in their own cars, sleeping in their own beds, shipping the testing kits from place to place. The result is a nationwide, COVID-safe test, but without the rural data we usually provide.

PCMag also started placing more emphasis on 5G connections. I’m a big fan of how PCMag handled 5G performance in its scoring (emphasis mine):

We had separate sets of 4G and 5G phones running tests offset by 60 seconds from each other…We ended up choosing the best result from each of the two devices on the same network, no matter what G they were on…What people really want is a consistent broadband experience—they don’t care what the icon on their phone says.

Reservations

Most of my reservations last year still stand. Notably:

  • PCMag focuses on performance within cities, while the largest differences between networks’ performance tend to show up in less-populated areas.
  • Average speed metrics get more weight than I think is reasonable.
  • Scores on different metrics get aggregated in a problematic way.

Highlights

While my reservations are serious, they’re not relevant to the granular, city-specific results. If you live in a large metro area, PCMag’s scorecard for your city could be handy.

The 5G-availability data is interesting. Here’s each network’s overall score for 5G availability:

  • T-Mobile: 54%
  • AT&T: 38%
  • Verizon: 4%

I’m surprised how close AT&T came to T-Mobile. While Verizon’s 4% availability score isn’t impressive, it’s higher than I anticipated. Verizon has been getting berated for the horrible availability of its exclusively millimeter wave 5G. Since Verizon hasn’t rolled out any 5G in some cities, the overall result masks heterogeneity between cities. E.g., PCMag found 9% 5G availability for Verizon in Chicago.

Futuristic city

AT&T Wins in GWS’s New Report – Reservations Remain

Global Wireless Solutions (GWS) released its latest report ranking the performance of cellular networks in the U.S. AT&T again took the top spot in GWS’s rankings.

I previously wrote about my reservations around the methodology GWS used in 2019. My reservations stand nearly unchanged. GWS continues to assess about 500 markets rather than the U.S. at large. I think this makes GWS biased against Verizon, the network that indisputably leads in coverage.

In its latest report, GWS boasts about having the largest and most comprehensive assessment of cellular networks. The claims seem to be based on the large number of data points GWS collects. In my view, the extra data points don’t make up for the fact that GWS’s underlying methodology isn’t as good as RootMetrics’ methodology.

Network operators pay evaluators to license their awards. Is GWS using a funky methodology because the company stands to earn more from declaring AT&T the best network than it would earn from declaring Verizon the best network?

Don’t Take Ookla Too Seriously

Ookla recently published its Q2 report on the performance of U.S. wireless networks. As I’ve discussed before, I’m not a fan of Ookla’s methodology.1 Because of my qualms, I’m not going to bother summarizing Ookla’s latest results. However, I do want to draw attention to a part of the recent report.

Ookla’s competitive geographies filter

In the last year or two, Ookla has restricted its main analyses to only account for data from “competitive geographies.” Here’s how Ookla explains competitive geographies:

To meet the definition of ‘competitive’ in the U.S., a zip code must contain samples from at least three top national competitors…but no competitor can have more than 2/3 of the samples in that zip code.

The competitive geographies filter mitigates some of the problems with Ookla’s methodology but also introduces a bunch of new issues.

Availability

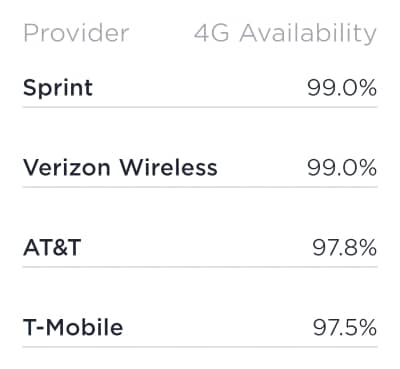
Ookla’s latest results for 4G availability illustrate the issues:

Ookla 4G availability scores

Sprint unambiguously has the smallest coverage profile of the four nationwide networks.2 The competitive geographies filter makes Ookla’s availability metric so meaningless that Sprint can nevertheless tie for the best availability.

Lots of regions only have coverage from Verizon. All those data points get thrown away because they come from non-competitive geographies. Other areas have coverage from only Verizon and AT&T. Again, those data points get thrown out because they’re not from competitive geographies. What’s the point of measuring availability while ignoring the areas where differences in network availability are most substantial?

Giving Ookla credit

Despite my criticisms, I want to give Ookla some credit. Many evaluators develop complicated, poorly thought-out metrics and only share those metrics when the results seem reasonable. I appreciate that Ookla didn’t hide its latest availability information because the results looked silly.

Opensignal’s Report on U.S. 5G Performance – No Big Surprises

Earlier this week, Opensignal released a report on the performance of 5G networks in the United States. Opensignal’s report puts some numbers and data behind two things that were already clear:

  • T-Mobile is destroying the competition in terms of 5G coverage, but T-Mobile’s 5G isn’t very fast
  • Verizon’s 5G is outrageously fast, but the coverage profile is terrible.

Opensignal primarily collects its performance data by crowdsourcing data from tests that run in the background on regular people’s phones. It looks like the company restricted the data underlying this report to include tests run from 5G-compatible phones.

Speeds

Verizon destroyed the competition with an average 5G download speed of 495Mbps. The other major networks in the U.S. had 5G download speeds averaging around 50Mbps. Verizon’s dominance in download speeds is due to the company’s focus on rolling out millimeter wave 5G.

Coverage

Unlike Verizon, T-Mobile has focused on deploying sub-6 5G. This type of 5G is great for covering large areas, but less impressive for delivering high speeds. Unsurprisingly, T-Mobile dominated in terms of 5G availability. According to Opensignal’s data, T-Mobile subscribers were able to access 5G 22.5% of the time. Verizon did about fifty times worse with an availability score of 0.4%.

While 0.4% is low, it’s still a better availability score than I would have predicted for Verizon. I wonder if Opensignal’s crowdsourcing approach might lend Verizon’s availability scores a leg up. If living near a Verizon 5G deployment makes a Verizon customer more likely to purchase a 5G phone, selection bias can creep in and cause Opensignal to overestimate Verizon’s actual 5G availability.

Silly press releases

Following Opensignal’s release of its report, T-Mobile published a press release. The company bragged about the network’s excellent 5G coverage without mentioning that the network got demolished in the download speed results.

Verizon published its own press release bragging about ludicrous download speeds. Verizon’s awful 5G availability score was not mentioned.

Download Speed Experience – 5G Users

Opensignal’s report included a metric called Download Speed Experience – 5G Users. The results for this metric were calculated by looking at users with 5G-compatible phones and tracking their average download speed even at times where they did not have 5G connections. In some sense, this single metric does some accounting for both 5G speeds and 5G availability.

Verizon and AT&T tied for the top spot:
Results graph showing AT&T and Verizon tied for the top spot

The metric is interesting, but I don’t think it quite captures how users will feel about the quality of their download speed experiences. The marginal value of a 10Mbps boost in download speeds that moves a subscriber from 5Mbps to 15Mbps is much greater than the marginal value of a 10Mbps boost that moves a subscriber from 500Mbps to 510Mbps. Collapsing a distribution of download speeds into a single, average download speed masks this reality.

Proof & Network Evaluations

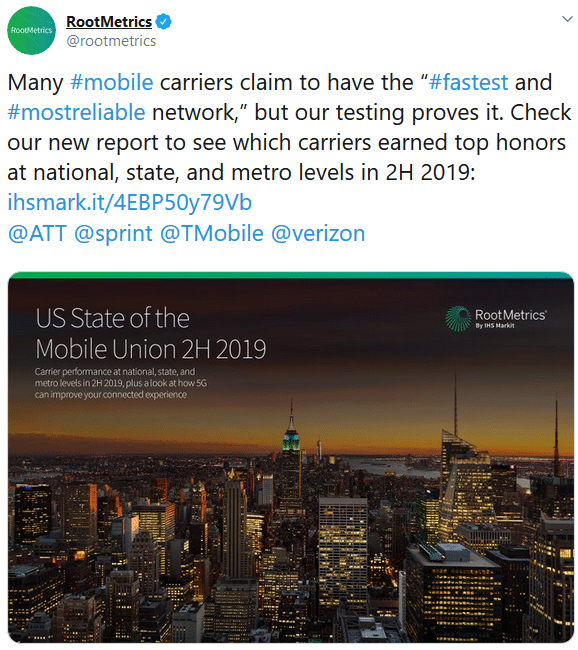
RootMetrics recently tweeted about how its latest analyses prove which networks are the fastest and most reliable:

RootMetrics' Tweet

I’m a big fan of RootMetrics, but the tweet annoyed me. There’s a ton of flexibility in how network evaluators can approach their work. Will performance data be crowdsourced from consumers or collected via in-house testing? How will data be cleaned and aggregated? What regions will be included? Etc.

Phrases like “fastest network” and “most reliable network” are ambiguous. Do you determine the fastest network based on average download speeds, median download speeds, or something else?

RootMetrics’ tweet is especially odd in light of their latest report. Depending on which speed metric you choose to look at, you could argue that either Verizon or AT&T has the fastest network. AT&T narrowly beats Verizon in terms of median download speed. Verizon narrowly beats AT&T in RootMetrics’ overall speed scores.1

RootMetrics’ Results In Dense City Centers

RootMetrics’ most recent report includes information about network speeds in city centers. Here’s how RootMetrics’ describes the tests:1

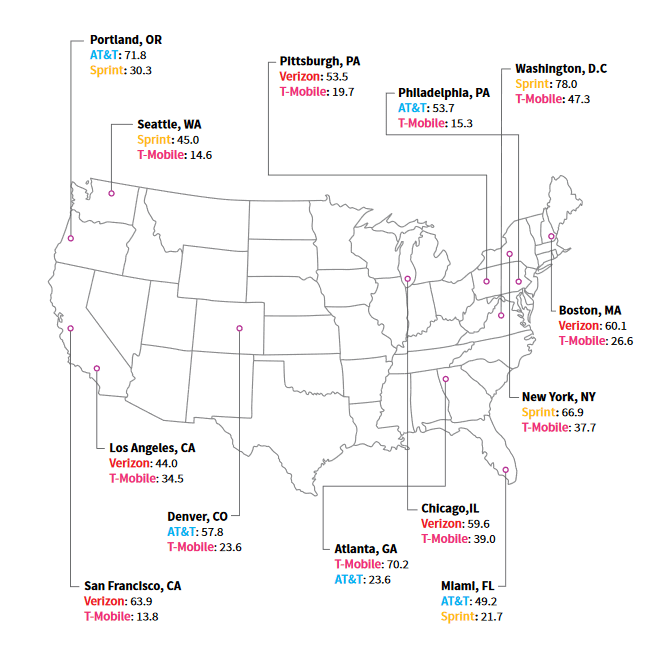
Capacity is critical for a good mobile experience in highly congested areas. To show you how the carriers performed in high-traffic areas of select cities, we measured each carrier’s median download speed outdoors in the dense urban cores of 13 major cities across the country.

The results are presented with the following graphic that lists the median download speed in megabits per second from the fastest and slowest network in each city:2

RootMetrics' median download speeds in city centers

Despite Sprint’s lousy performance in RootMetrics’ overall, national-level results, Sprint still managed to offer the fastest speeds in 3 of the 13 city centers RootMetrics considered. The results are consistent with a point I’ve tried to emphasize in the past: if you tend to stay in one area, you shouldn’t worry too much about national-level network performance.

Prioritization

I haven’t seen information about which plans RootMetrics’ test devices use on each network. In fact, I’m not entirely sure RootMetrics uses service plans that are available to regular consumers. My guess is that RootMetrics’ test devices have prioritization and quality of service levels at the high-end of what’s available to regular consumers. If my guess is correct, RootMetrics’ test devices have higher priority than many budget-friendly services that run over the Big Four networks. A few examples of those services:

  • AT&T: Cricket Wireless unlimited plans
  • T-Mobile: Metro by T-Mobile plans
  • Sprint: Mobile hotspot plans and Boost Mobile plans
  • Verizon: Verizon Prepaid plans, the Start Unlimited plan, and Visible plans

Subscribers using low-priority services are especially likely to experience slow speeds in congested areas. I’d be interested in seeing RootMetrics rerun its city-center tests with low-priority services.

RootMetrics’ Report For Late 2019

Yesterday, RootMetrics released its latest report on the performance of U.S. wireless networks. I’d been looking forward to this report. RootMetrics’ drive testing methodology has some advantages over the approaches used by other companies that evaluate network performance.

Results

RootMetrics’ results were generally unsurprising. As with the last report, Verizon was the big winner, followed by AT&T in second place, T-Mobile in third, and Sprint in fourth.

Here are the overall, national scores out of 100 for each of the major networks:

  • Verizon – 94.6 points
  • AT&T – 93.2 points
  • T-Mobile – 86.5 points
  • Sprint – 83.2 points

RootMetrics also reports which carriers scored the best on each of its metrics within individual metro areas. Here’s how many metro area awards each carrier won (along with the change in the number of rewards received since the last report):

  • Verizon – 660 awards (-12)
  • AT&T – 401 awards (+21)
  • T-Mobile – 217 awards (-20)
  • Sprint – 80 awards (-9)

AT&T’s improvements

RootMetrics’ results align with the results of other recent evaluations suggesting aspects of AT&T’s network are becoming more competitive. AT&T fared particularly well in RootMetrics’ latest speed metrics. While Verizon narrowly beat AT&T in the final speed score out of 100 (90.7/100 for Verizon vs. 90.2/100 for AT&T), AT&T narrowly beat Verizon in aggregate median download speed (33.1 Mbps for AT&T vs. 32.7 Mbps for Verizon).

It appears that RootMetrics’ final speed scores are based on something more than median download speed. That may be a good thing: having consistent speeds is arguably much more important than having high average or median speeds. Still, I’m frustrated that I can’t figure out exactly how the final speed scores are derived. RootMetrics continues to be non-transparent about the math underlying its analyses.

A section of the latest report suggests that Verizon may do a particularly good job of avoiding sluggish speeds:

Verizon’s ‘slowest’ median download speed of 17.9 Mbps, recorded in Fresno, CA, was still quite strong and would allow end users to complete the majority of data tasks with ease. In fact, Fresno was the only market in which Verizon registered a median download speed below 20 Mbps. No other carrier came close to matching Verizon’s consistency of delivering fast speeds in metros across the US.

5G performance

The new report includes details about RootMetrics’ recent tests on 5G networks. I found the 5G results unsurprising, and I’m not going to comment on them further at this time. I think 5G deployments are still in too early a stage for the results to be of much interest.

Opensignal’s 2020 U.S. Mobile Performance Report

Today, Opensignal released a new report on the performance of U.S. wireless networks. The report details results on seven different metrics.

Here are the networks that took the top spot for each metric at the national level:

  • Video Experience – Verizon
  • Voice App Experience – T-Mobile/AT&T (draw)
  • Download Speed Experience – AT&T
  • Upload Speed Experience – T-Mobile
  • Latency Experience – AT&T
  • 4G Availability – Verizon
  • 4G Coverage Experience – Verizon

It’s important to interpret these results cautiously due to limitations in Opensignal’s crowdsourcing approach. Since performance data is collected from actual subscribers’ devices, factors not directly related to underlying network quality may impact the organization’s results. For example, if subscribers on a network are unusually likely to use low-end devices or live in rural areas, that will affect the outcome of Opensignal’s analyses. Still, Opensignal’s results are interesting; they’re drawn from a huge data set involving primarily automated performance tests.

Download speed findings

The most notable result in the latest report might be AT&T’s first-place finish on the download speed metric. In the previous Opensignal report, T-Mobile won first place for download speeds, and AT&T took third place. I’ve recently been critical of the methodologies used in some other evaluations that suggested AT&T had the nation’s fastest network. While many of those methodological criticisms still stand, the fact that Opensignal’s arguably more reliable methodology also found AT&T to have the fastest network leads me to believe I was too harsh. I’ll be interested to see whether AT&T also takes the top spot for speeds in RootMetrics’ upcoming report.

New metrics

Two new metrics were introduced in this report: Voice App Experience and 4G Coverage Experience. The Voice App Experience metric assesses the quality of voice calls via apps like Skype and Facebook Messenger. I’m not exactly sure how the metric works, but it looks like all four networks received similar scores. Opensignal deemed all these scores as indicative of “acceptable” quality.

The 4G Coverage Experience metric adds a bit of complexity to the previously existing 4G Availability metric. The coverage metric assesses 4G availability across areas all Opensignal’s users find themselves in, regardless of their network.