
The quality of wireless service in the U.S varies substantially between locations, but services’ prices generally don’t vary much by location. A low-cost network with mediocre national coverage might have top-notch coverage in your local area. Understanding service quality may help you to save a ton of money.
I’ve spent a while digging into the evaluation strategies used by firms that assess cell phone services. I’ve written about many of these firms’ methodologies: Consumer Reports, Nielsen, Opensignal, RootMetrics, and Tutela. In this article, I’ll explain how you can draw on some of these firms’ data to assess network performance in areas you spend time.
U.S. networks
There are only four wireless carriers in the U.S. with their own nationwide network infrastructure: Verizon, AT&T, T-Mobile, and Sprint (collectively called the “Big Four”). Many carriers that are not part of the Big Four are mobile virtual network operators (MVNOs). MVNOs don’t have their own networks. Instead, MVNOs exclusively resell access to other companies’ networks. In most cases, MVNOs resell access to the Big Four networks. Along with MVNOs, there are a large number of regional carriers that are not part of the Big Four. While regional carriers have their own network hardware, they can only offer nationwide service via partnerships with the Big Four networks.
Although there are way more than four wireless carriers in the U.S., the vast majority of wireless communication is transferred over the Big Four networks’ hardware. Accordingly, consumers assessing wireless service quality should usually focus on the quality offered by each of the Big Four networks.
Reliability is essential
For typical consumers, it’s not important for download speeds to be as high as possible. What’s important is that speeds are sufficient. While wireless networks often deliver speeds over 25 megabits per second (Mbps), a 2 Mbps connection is sufficient for performing most internet browsing, music streaming, and even low-quality video streaming without trouble.1 For most consumers, consistently having decent speeds is way more important than having high average speeds.
The goal: Rank the Big Four
As you go through the process I outline, try to come up with a ranking of the quality of the service Big Four carriers offer in areas where you spend time.2
- Verizon and AT&T’s services are roughly tied—both look quite good.
- T-Mobile’s service looks decent but significantly less good than Verizon or AT&T where John lives. The service is spotty in areas John sometimes travels to.
- Sprint’s service appears mediocre and worse than any of the other Big Four carriers. Service is lousy in John’s local area. Sprint has no coverage at the vacation house John spends a few weeks at each summer.
Assessing network quality
When assessing networks, I suggest placing more weight on third-party evaluators’ data rather than carriers’ self-reported data or anecdotes from people who live near you. That said, third-party data may not be available in all the geographic areas you spend time in, so you’ll have to make do with what’s available.
Where you live and work
Let’s start by assessing network quality in your local area. There are a few different approaches I recommend. In most cases, I suggest trying the approaches in the order I’ve listed them.
Option #1: Opensignal’s app (time cost: ~20 minutes)
Opensignal’s methodology involves crowdsourcing lots of performance data from regular consumers. If you download the OpenSignal app, you can explore maps that report finely-grained, crowdsourced data.
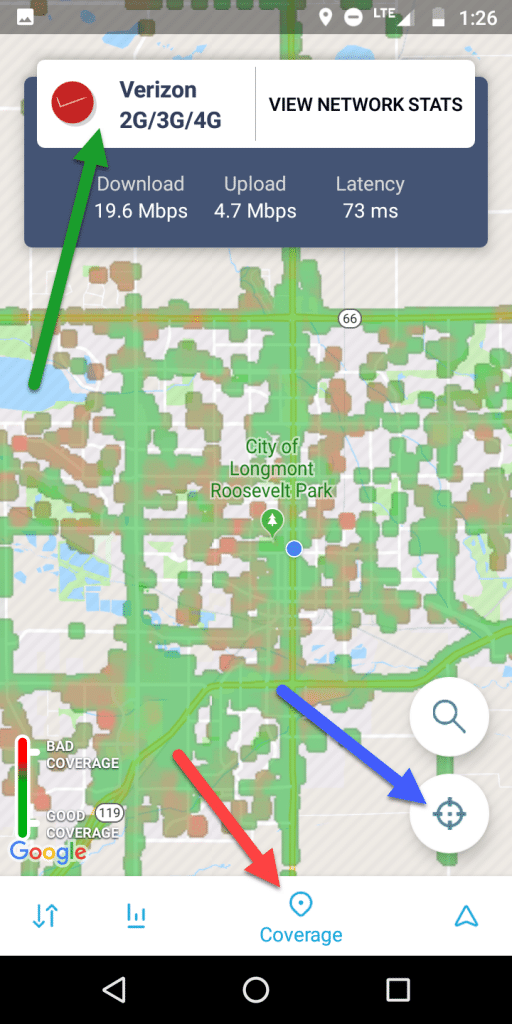
To view these maps, download the app (Apple or Android), tap the coverage section (red arrow), then go to your location (blue arrow). I suggest switching between the maps for each of the Big Four carriers (green arrow) and exploring each network’s performance in your local area. Ideally, you’ll see a lot of green and not very much red. It’s especially important that areas where you live, work, or otherwise spend a lot of time are highlighted in green.
If there isn’t enough data (i.e., if the map doesn’t have much color), you may have better luck with one of the next options.
Option #2: RootMetrics’ reports (time cost: ~5 minutes)
RootMetrics collects much of its data through a rigorous, drive-testing method. Phones connected to all the major networks are driven around the U.S. to collect performance data. This method may not capture some real-world scenarios that Opensignal’s crowdsourcing captures, but RootMetrics’ methodology involves a more controlled environment. Phones perform essentially the same tests in the same places for all carriers. While I think Opensignal’s app is great for assessing network performance at a finely-grained geographic level, I worry that Opensignal’s analyses of large geographic areas may be affected by serious selection bias. I strongly prefer RootMetrics’ reports when trying to get a high-level assessment of service quality in a large area.
If you live in a decent-sized metro area, there’s probably a RootMetrics report detailing service quality in your area. Head over to RootMetrics’ website to view the reports.
Here’s a snapshot of the RootMetrics’ report for Denver:3
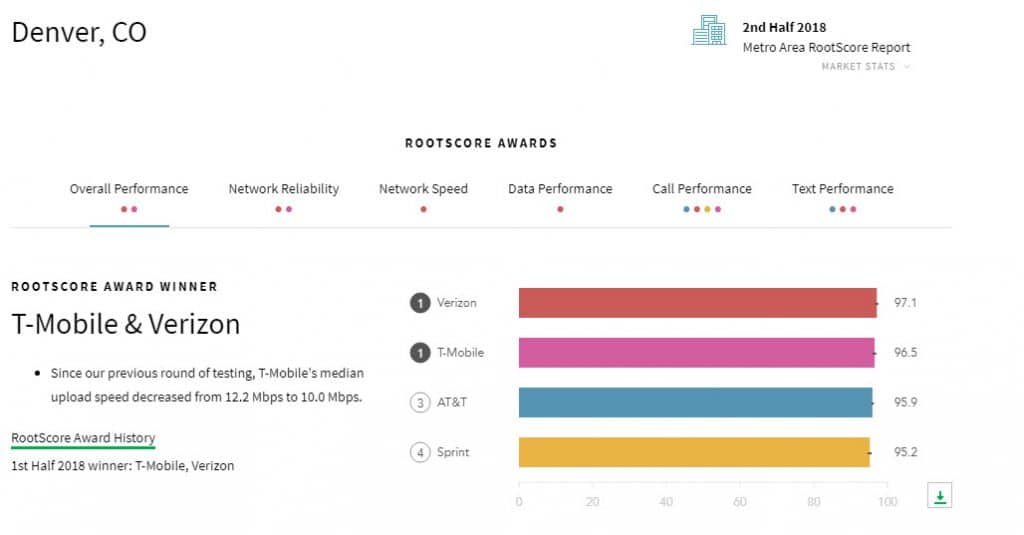
The report initially displays overall scores for each carrier. You can also explore results in individual categories like “data performance” and “call performance.” In the Denver report, T-Mobile and Verizon tied for the top spot, but AT&T and Sprint also do well. The situation in Denver is a lot different from the situation in Hudson Valley, NY:4
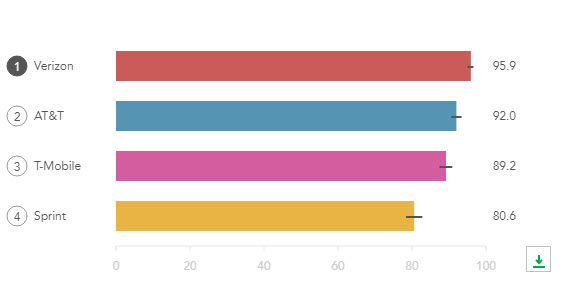
While Sprint does a little worse than the other carriers in Denver, Sprint is way behind the other carriers in Hudson Valley. Rather than just accounting for carriers’ positions in the rankings, consider the absolute scores and the differences between scores.5
Option #3: Ask around (time cost: ?)
It’s possible that neither Opensignal or RootMetrics will have the information necessary to assess coverage quality where you live. If so, I suggest asking people who live and work near you about their experiences with cell services. This approach has a lot of limitations—people use different phones, coverage quality can vary between homes in the same neighborhood, etc.—but it’s better than nothing.
Option #4: Trial and error (time cost: months)
If none of the options above give you a clear sense of coverage quality in your area, trial and error may be the way to go. Trying several carriers is a pain, but you can minimize the expense and annoyance by (a) using a device with near-universal compatibility, (b) purchasing 1 month of prepaid service at a time, and/or (c) porting your primary number to Google Voice. If you’re feeling patient and frugal, I suggest starting with low-price services from mobile virtual network operators and only trying more expensive options if the cheap services turn out to be inadequate.
Other areas you spend time
If you spend much time outside of the areas where you live and work, I suggest investigating coverage quality in those areas as well. For the most part, the Big Four networks are decent in big cities. However, networks differ significantly in quality in less-populated areas.
If you spend a lot of time in just a few other areas, you may want to repeat what’s outlined in Option #1 or Option #2 for each area. If you spend time in many places, you may want to assess networks at a higher level. RootMetrics offers state-level performance reports and a national report. Here’s how the carriers stack up according to RootMetrics’ most recent national report:7
- Verizon
- AT&T
- T-Mobile
- Sprint
That ordering is consistent with my own impression, which I discuss in way more detail in the article Reliability of Nationwide U.S. Wireless Networks.
Find a balance between price and quality
Once you have a sense of network quality in areas where you use your phone, start sifting through prices and plans carriers offer to decide what makes sense given your needs and budget. While searching for a plan, I highly recommend considering MVNOs. It’s often far cheaper to purchase service from an MVNO that uses a given Big Four network than it is to purchase service directly from the Big Four carrier.8
Footnotes
- As of 4/9/2019, Google lists the bitrate for 240p Youtube videos as 300 – 700 Kbps. See Google’s Live encoder settings, bitrates, and resolutions page (archived here).
- If you live in an area that U.S. Cellular covers, I recommend considering U.S. Cellular also.
- Image from RootMetrics’ report on Denver, CO for the second half of 2018.
- Image from RootMetrics’ report on Hudson Valley, NY for the second half of 2018.
- Unfortunately, making sense of the absolute scores isn’t straightforward. RootMetrics is frustratingly non-transparent about how it calculates its scores. It is not easy to arrive at clear, concrete interpretations of what scores mean. This is one of the reasons I prefer relying on Opensignal’s data when assessing performance in small geographic regions.
- 6In RootMetric’s report for the second half of 2018, Verizon scores 96.1 for network reliability, AT&T 94.4, T-Mobile 88.2, and Sprint 87.5. The same rank order of carriers is seen in the scores for overall performance.
In Opensignal’s January 2019 report, Verizon strikes me as the overall winner in the nationwide analysis. Interestingly, T-Mobile beats AT&T by a significant amount in the 4G availability metric covered in the same report (94.0% versus 88.9%).
- Before purchasing service from an MVNO, I suggest double checking that the MVNO offers service where you spend most of your time (most MVNOs share coverage maps on their websites). MVNOs may not have the same roaming agreements as the Big Four carriers themselves.
