Hello friends!
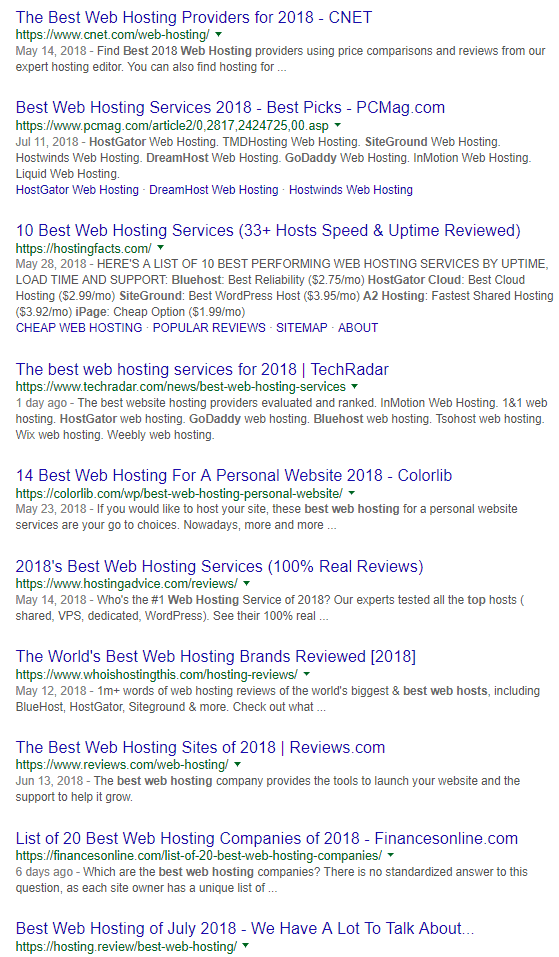
Today I’m happy to announce a new, innovative project! The seeds of this idea were planted several months ago when I published Third-party Evaluation: Trophies for Everyone! In that post, I mentioned how legitimate companies seem surprisingly comfortable advertising awards from entities that totally lack credibility.
Since then, I’ve noticed more forms of bogus website endorsements. For example, Comodo Group’s trusted site seals:
You can get these seals for free here. You don’t even have to verify that you’re using any kind of security! I indicated that I have a UCC SSL certificate. I don’t have one of those, but look at the cool seal I got!

UC SSL Certificate
SiteLock also offers cool security seals. They look like this:

That’s just an image for illustrative purposes. It’s not a real, verified seal. Getting an actual seal costs money and involves verification. The verification component is interesting. If SiteLock realizes a site is not safe for visitors, will the seal make that clear?
Nope!
All this got me thinking. What if I offered free, honest endorsement seals?
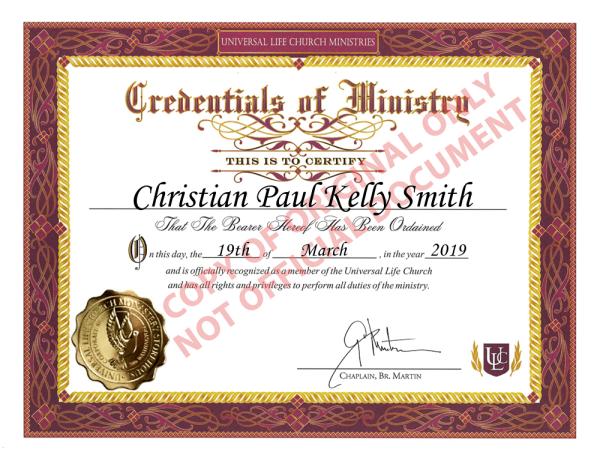
This idea had an obvious flaw: a total lack of credibility or credentials on my part. I decided it was time I got myself some credentials. I went to the Universal Life Church (ULC) website and began the arduous process of becoming an ordained minister. After painstakingly entering my personal details and clicking the “Get Ordained Instantly” button, I had my first credential:
A few days later, I had physical proof:
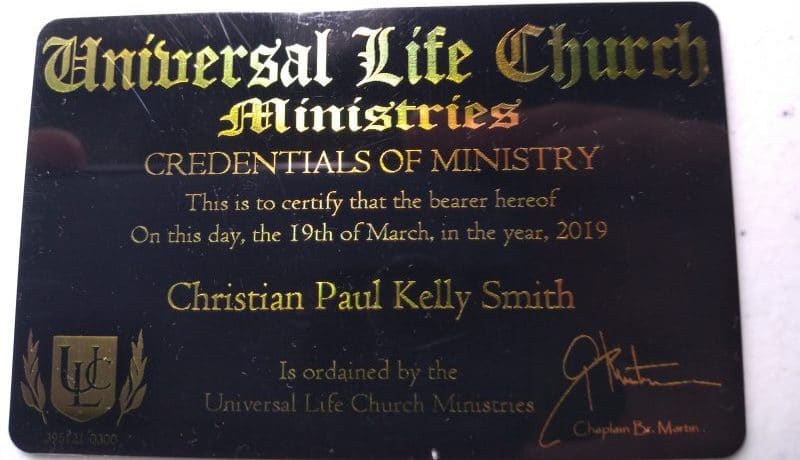
A lot of people have been ordained by the ULC. To make sure people could know I’m really trustworthy, I went ahead and got a few less common credentials:
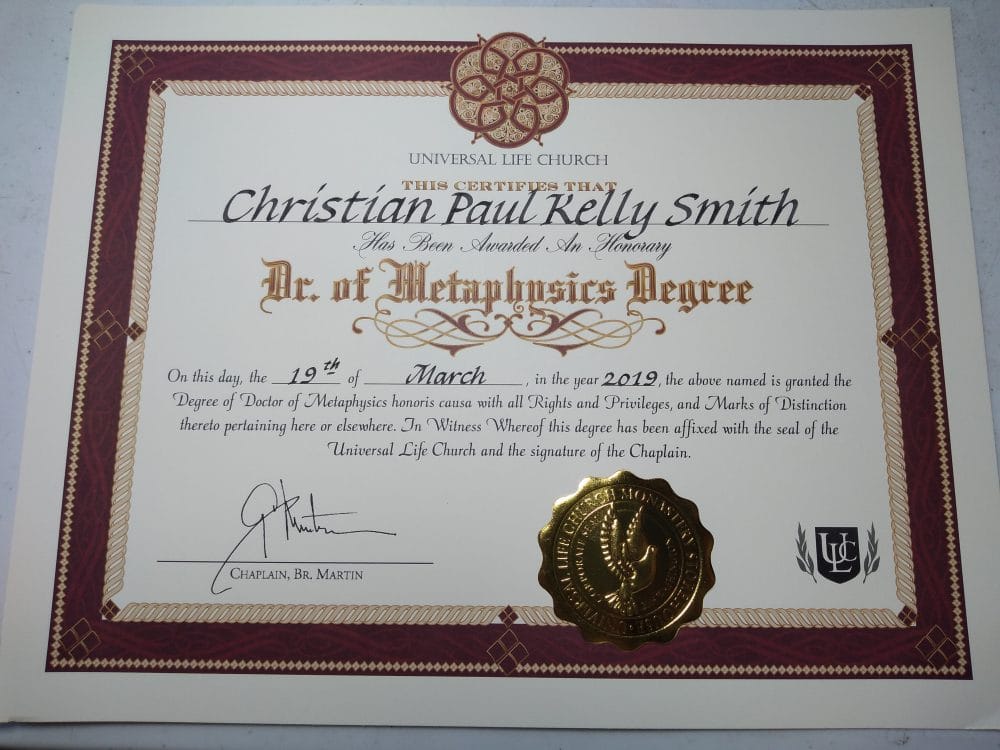
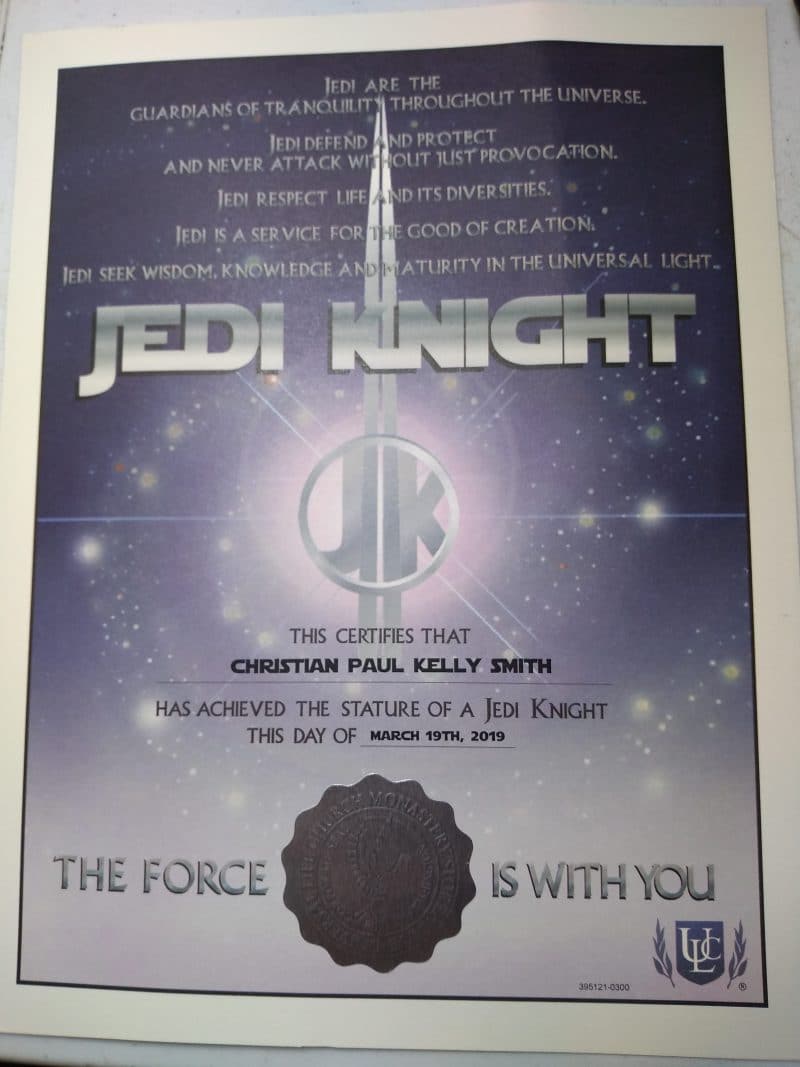
After acquiring my credentials, I spent an intense eight minutes creating a professional endorsement seal:

You can get one of these seals for your own website if you certify its awesomeness. If you’re not sure if your website is awesome, the book On Being Awesome: A Unified Theory of How Not to Suck might be able to help. Click below if you’re ready:
<a href="https://coveragecritic.com/2019/04/01/become-certified-awesome-today/"><img src="https://coveragecritic.com/wp-content/uploads/2019/03/ConfusopolyEndorsment.png" width="800" height="600" class="aligncenter size-full wp-image-2338" /></a>
May the force be with you,
Dr. Christian Smith, PhD