Opensignal’s 2020 U.S. Mobile Performance Report

Today, Opensignal released a new report on the performance of U.S. wireless networks. The report details results on seven different metrics.

Here are the networks that took the top spot for each metric at the national level:

  • Video Experience – Verizon
  • Voice App Experience – T-Mobile/AT&T (draw)
  • Download Speed Experience – AT&T
  • Upload Speed Experience – T-Mobile
  • Latency Experience – AT&T
  • 4G Availability – Verizon
  • 4G Coverage Experience – Verizon

It’s important to interpret these results cautiously due to limitations in Opensignal’s crowdsourcing approach. Since performance data is collected from actual subscribers’ devices, factors not directly related to underlying network quality may impact the organization’s results. For example, if subscribers on a network are unusually likely to use low-end devices or live in rural areas, that will affect the outcome of Opensignal’s analyses. Still, Opensignal’s results are interesting; they’re drawn from a huge data set involving primarily automated performance tests.

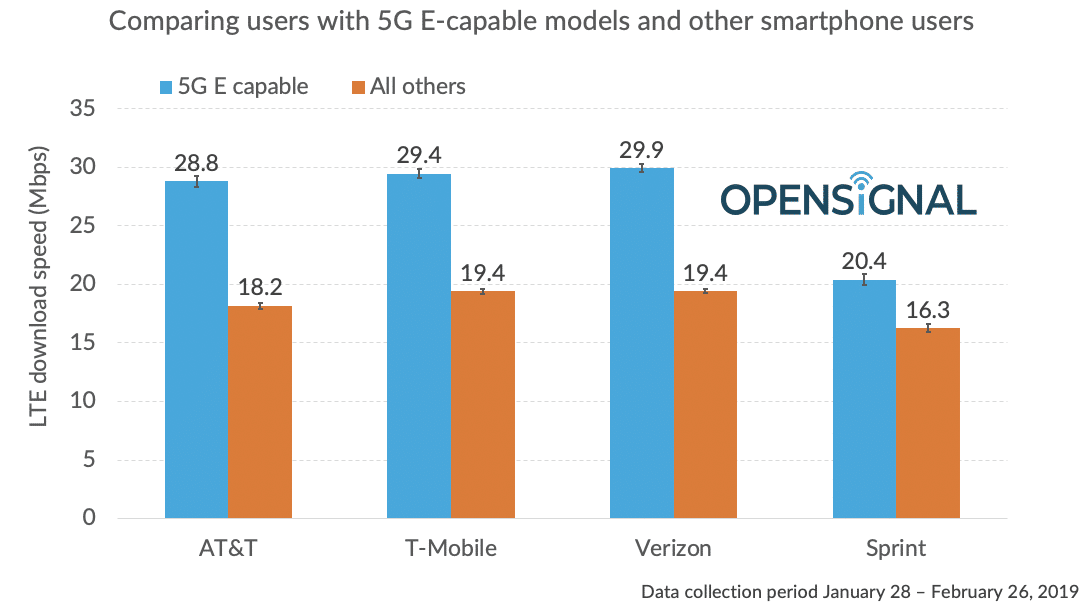
Download speed findings

The most notable result in the latest report might be AT&T’s first-place finish on the download speed metric. In the previous Opensignal report, T-Mobile won first place for download speeds, and AT&T took third place. I’ve recently been critical of the methodologies used in some other evaluations that suggested AT&T had the nation’s fastest network. While many of those methodological criticisms still stand, the fact that Opensignal’s arguably more reliable methodology also found AT&T to have the fastest network leads me to believe I was too harsh. I’ll be interested to see whether AT&T also takes the top spot for speeds in RootMetrics’ upcoming report.

New metrics

Two new metrics were introduced in this report: Voice App Experience and 4G Coverage Experience. The Voice App Experience metric assesses the quality of voice calls via apps like Skype and Facebook Messenger. I’m not exactly sure how the metric works, but it looks like all four networks received similar scores. Opensignal deemed all these scores as indicative of “acceptable” quality.

The 4G Coverage Experience metric adds a bit of complexity to the previously existing 4G Availability metric. The coverage metric assesses 4G availability across areas all Opensignal’s users find themselves in, regardless of their network.

Boost’s “Super Reliable, Super Fast” Network

Boost Mobile is running a new commercial that features Pitbull and pitches the company’s low prices. Towards the end of the ad, a narrator says that Boost has a “super fast, super reliable network.” The narration is accompanied by this image:


In most commercials that involve carriers making claims about service quality, carriers will use fine print to cite research that backs up their claims. The Boost ad doesn’t include a citation; perhaps that’s because Boost’s claim doesn’t have much substance. “Super fast, super reliable” is super vague. Boost’s service probably is super fast compared to wireless service from 15 years ago. On the other hand, Boost’s service is not super fast compared to most services currently offered by other U.S. carriers.

Boost runs over Sprint’s network. There are a lot of different companies that evaluate network performance, and Sprint tends to do poorly relative to its competitors in the rigorous evaluations. Sprint had the lowest speeds among all four major networks in both RootMetrics’ and Opensignal’s most recent national assessments.

Boost’s claim looks even sillier in light of the fact that its subscribers tend to have low priority data access on Sprint’s network. When Sprint’s network is congested, Boost Mobile’s subscribers will tend to experience slower data speeds than those who subscribe directly to Sprint’s service.

A misleading image accompanies Boost’s misleading claims about quality. The image looks like a coverage map showing extensive coverage, but a disclaimer states: Coverage not available everywhere. Not a depiction of actual coverage.

Here’s the full commercial:

Visible Continues To Throttle Some Phones

When the wireless carrier Visible first launched, Visible throttled data speeds to a maximum of 5Mbps. In June, Visible announced a removal of the cap for new and existing customers:

Starting today, and for a limited time, we’re removing the 5 Mbps data speed cap for our current and new members at no added cost…everyone who gets to experience uncapped speeds will get to keep them — again, at no additional cost — as long as they are a member.

Last week, I started trialing Visible’s service. Speed tests I ran all found download speeds of about 5 or 6 Mbps. Whether I had a strong LTE connection or a weak one, I experienced about the same download speed.

Summary of several Visible speed test results showing download speeds around 5Mbps

Each of the tests showed a weird pattern. After initiating a test, speeds would briefly shoot up well beyond 5Mbps (red arrow) before stabilizing around 5Mbps (green arrows).

Speed test result showing speeds stabilize around 5Mbps

Shortly after experiencing these weird test results, I found a Reddit thread where other Visible subscribers mentioned similar problems. Here’s the original post by Reddit user n0ki:

I now have 2 phones moved over to Visible. Both phones max out at 5mbps. After spending an hour or so with chat support and going through all their troubleshooting, I finally convince her that even though my account shows its not capped, that is is acting like it is. She finally decides to “reset” the cap and that resolves the issue.

I reach out to support on my 2nd phone and explain I’m having the same problem and what the solution is. They want me to spend another hour going through all the same troubleshooting steps.

Frustrating that it’s currently advertised as unlimited but all these new accounts still seem to be capped at 5!

Most of the people experiencing the issue were using the Visible R2, the same phone I experienced an issue with.

I went ahead and reached out to Visible’s support. After a live chat conversation that took about 20 minutes, I was experiencing much faster download speeds:

Speed test result finding a download speed of 17Mbps

While it’s unimpressive that Visible seems to still be throttling some subscribers, I’m inclined to believe the issue is due to an honest mistake on Visible’s end.

Location, Location, Location

In my opinion, major wireless networks can be ranked pretty clearly in terms of their current, nationwide reliability:

  1. Verizon (best)
  2. AT&T
  3. T-Mobile
  4. Sprint (worst)

I get frustrated when network operators make misleading statements about nationwide quality, and I sometimes write articles calling out bullshit claims. That said, a network’s typical reliability throughout the U.S. may be very different from that network’s quality in a given area. When deciding which carrier you should use, it only matters how carriers perform where you want to use your phone.

In the last year, I’ve run speed tests in Boulder, Colorado with a bunch of carriers (using all four of the major U.S. networks). A few days ago, I ran a speed test on a phone with service from Tello, a carrier that runs over Sprint’s network. While Sprint has the worst nationwide network, the speed test found a download speed far faster than I’ve seen in Boulder with any other carrier:

129 Mbps speed test result

As a general rule, service is more expensive on networks with better nationwide performance. If you live where an underdog network performs well, you might be able to get great service at a bargain price.

Prioritized and Deprioritized Services by Network

Understanding networks’ prioritization policies can be tricky. Recently, I’ve spent some time digging through the major U.S. networks’ policies. I’ve created a web page for each network listing which services I expect to be prioritized and which services I expect not to be prioritized. Making sense of each network’s policies isn’t always easy, so it’s possible I’ve misclassified some services. Please contact me if you think any information is incorrect or missing.


2021 Update: Over the last few years, I’ve run a bunch of QCI tests to assess priority levels of different plans, and I’ve become more confident about my conclusions. Results from QCI tests can be found here.

Lies, Damned Lies, and AT&T’s 5GE

There are three kinds of lies: lies, damned lies, and statistics.Benjamin Disraeli*

Fortunately, the sentiment behind this quote isn’t always accurate. Sometimes statistics can reveal lies. AT&T has recently taken a lot of heat for misleadingly branding advanced 4G networks as “5GE.” Ian Fogg at Opensignal published a post where he draws on Opensignal’s data to assess how AT&T’s 5GE-enabled phones perform compared to similar phones on other carriers. The results:1

In response to AT&T’s misleading branding, Verizon launched a video advertisement showing a head-to-head speed comparison between Verizon’s network and AT&T’s 5GE network.

In that video, Verizon’s 4G LTE network comes out with a download speed near 120Mbps while AT&T’s 5GE network came out around 40Mbps. That, of course, seems funny given the Opensignal data suggesting the networks deliver similar speeds on average.

A portion of the Verizon video—not long enough to show the final results—showed up in a Twitter ad. That ad led to a Twitter exchange between myself; Light Reading’s editorial director, Mike Dano; and Verizon’s PR manager, Steven Van Dinter. Dinter explained that Verizon chose to film in a public spot where AT&T’s 5GE symbol was very strong. I take Dinter’s word that there wasn’t foul play or blatant manipulation, but it is funny to see Verizon fighting misleading branding from AT&T with a misleading ad of its own.

Average Download Speed Is Overrated

I’ve started looking into the methodologies used by entities that collect cell phone network performance data. I keep seeing an emphasis on average (or median) download and upload speeds when data-service quality is discussed.

  • Opensignal bases it’s data-experience rankings exclusively on download and upload speeds.1
  • Tom’s Guide appears to account for data-quality using average download and possibly upload speeds.2
  • RootMetrics doesn’t explicitly disclose how it arrives at final data-performance scores, but emphasis is placed on median upload and download speeds.3

It’s easy to understand what average and median speeds represent. Unfortunately, these metrics fail to capture something essential—variance in speeds.

For example, OpenSignal’s latest report for U.S. networks shows that Verizon has the fastest average download speed of 31 Mbps in the Chicago area. AT&T’s average download speed is only 22 Mbps in the same area. Both those speeds are easily fast enough for typical activities on a phone. At 22 Mbps per second, I could stream video, listen to music, or browse the internet seamlessly. For the rare occasion where I download a 100MB file, Verizon’s network at the average speed would beat AT&T’s by about 10.6 seconds.4 Not a big deal for something I do maybe once a month.

On the other hand, variance in download speeds can matter quite a lot. If I have 31 Mbps speeds on average, but I occasionally have sub-1 Mbps speeds, it may sometimes be annoying or impossible to use my phone for browsing and streaming. Periodically having 100+ Mbps speeds would not make up for the inconvenience of sometimes having low speeds. I’d happily accept a modest decrease in average speeds in exchange for a modest decrease in variance.5