
Comparison shopping among mobile phone service providers is hard. Service quality is difficult to evaluate. Price structures and plan options vary between carriers and change every few months.
Industry overview
Most mobile phone subscribers in the United States use networks provided by the “Big Four”: Verizon Wireless, AT&T, T-Mobile, and Sprint.1 In addition to the Big Four, there are many smaller carriers with their own network infrastructure and lots of Mobile Virtual Network Operators (MVNOs).2 MVNOs offer cellular service but use network infrastructure managed by other companies (primarily the Big Four).3 MVNOs include companies like Tracfone, Mint Mobile, and Republic Wireless.
Evaluating service quality
Service quality is tough to evaluate. Some fairly objective variables differ between phone users—e.g., the location a device is used from or the type of phone that is being used. Some subjective considerations also come into play. How important is download speed relative to coverage quality? What makes customer service high-quality? Given all the variables and personal preferences involved, there is no good way to coerce all aspects of service quality into a single, reliable metric for comparison.
Third-party evaluators
Despite the difficulties, some third-party companies try to evaluate service quality. RootMetrics purchases off-the-shelf Android phones and drags them around the United States4 while collecting data about coverage and speed.5
In the most recent report (as of 4/25/2018), RootMetrics concludes:
Opensignal takes a crowdsourcing approach. It collects and analyzes a huge quantity of performance data from phones used by actual consumers.7 T-Mobile argues that this is a better approach.8 It’s also an approach that makes T-mobile look really good.9 Coincidence?
AT&T bills itself as “The nation’s largest and most reliable network.” On a prominent webpage10 discussing network quality, the reliability claim is paired with this footnote:
Sprint is more modest in its claim. Rather than declaring victory, Sprint explains:
Sprint’s claim is based on its own analysis of Nielsen data.12
Why do third-party evaluators come to different conclusions? Maybe coverage evaluation is just really hard. Alternatively, maybe market forces are strong enough to create financial incentives for one evaluator to look kindly on each major carrier. (See Third-party Evaluation: Trophies for Everyone!)
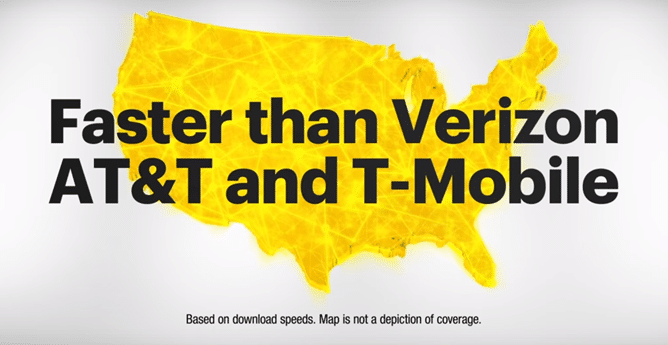
Since there are so many evaluators and metrics to choose from, each carrier can come up with a way to claim its service stands out from the competition. Thanks to this tendency, we get commercials with hilarious images like this one where Sprint advertises success on a speed metric. Note the disclaimer explaining that the coverage-map-like visual in the background is not a coverage map.13
Providers usually have an incentive to make their services look good. Since empirical data can be collected and analyzed in numerous ways, any carrier can come up with data-backed claims about service quality. In rare situations where the usual incentives are reversed, entertaining things can happen.
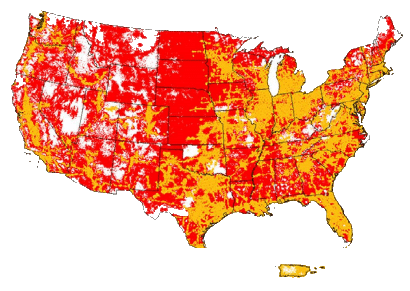
In a publicly accessible FCC filing used to pitch a potential T-Mobile-Sprint merger, Sprint admits an ongoing series of troubles it has faced. On a slide titled “Sprint’s Network Faces Severe Challenges,” there’s a bullet stating:
Revealing maps follow the statement:14

Mobile virtual network operators
MVNOs offer service that’s often far cheaper than service purchased directly from the Big Four. MVNOs, for the most part, use the Big Four’s networks. Does that mean MVNOs can offer service that matches the Big Four in quality?
As far as I know, the more rigorous third-party evaluators (i.e., Opensignal and RootMetrics) don’t collect data on MVNOs. Consumer Reports surveys its subscribers and collects data on individuals’ views about their carriers, including a number of MVNOs. Unfortunately, ConsumerReports’ rankings probably aren’t reliable. In a blog post, I go into detail about why I think Consumer Reports’ evaluation methodology is seriously flawed and biased against the Big Four.
Misleading marketing
Sometimes carriers blatantly mislead customers. For example, AT&T recently began labeling some of its advanced 4G LTE service as “5GE“. Understandably, this pissed off a lot of people, including other major carriers. AT&T’s 5GE service is not 5G. It’s 4G.
Confusing pricing
It’s a major undertaking for a consumer to figure out the prices he or she would have to pay for service from different carriers. Apples-to-apples comparisons are not always possible. Each carrier has its own way of bundling plans together. There’s no way to compare a 2 line plan with 1,000 minutes of voice, 1 gigabyte of data, and unlimited texts across five different carriers. Consumers are stuck with whatever bundles of options each carrier offers.
A consumer trying to carefully compare five carriers would probably need to choose a few different plans from each carrier and write down the prices of each plan along with details about terms and offerings of each plan.
Putting together all the information necessary to carefully comparison shop is a Herculean task. Lots of important information is hard to find. If a consumer manages to gather all the needed information, he or she still faces the difficulty of deciding which of the plans—each with different characteristics—is the best fit.
If a customer does manage to pull off all the work required, he or she can be almost confident that any conclusions won’t be valid for long. Prices and plans with most carriers will be revamped and restructured by the time a contract is up for renewal.
Footnotes
- See How Verizon, AT&T, T-Mobile, Sprint and more stacked up in Q4 2017: The top 7 carriers (archived copy) for subscriber numbers in late 2017.
- Wikipedia has a handy list of facilities-based service providers in the United States (archived copy).
I maintain a list of U.S. MVNOs.
There are a handful of brands owned and operated by the Big Four (e.g., Cricket Wireless, Metro, Visible). Sometimes these brands are referred to as “MVNOs”, but the term “flanker brand” may be a more accurate description.
- Not all MVNOs exclusively use networks provided by the Big Four. See Wikipedia’s List of United States mobile virtual network operators (archived copy) for more information about which networks MVNOs use.
- “To accurately reflect a typical consumer’s mobile experience, we use only off-the-shelf smartphones purchased from mobile network operator stores. We never alter the phones with external antennas or any other non-standard equipment, and we never “root,” jailbreak, or modify the phone’s software in any way. To reflect how consumers use their mobile phones, we also measure data, call, and text performance with the same device rather than testing each category with a separate device.
We select leading Android-based smartphones for each network during our device selection process. During the device selection process, RootMetrics benchmarks device models to determine the best commercially available phone model from each network in order to capture the best possible user experience for data, call, and text usage on each particular network.”
RootMetrics — Methodology (archived copy). Accessed 9/19/18. - “We measure network reliability and speed performance across the activities that consumers use their smartphones for on a daily basis, like checking email, browsing webpages, using apps, making calls, and sending texts.”
RootMetrics — Methodology (archived copy). Accessed 9/19/18. - See Mobile performance in the US part 1 | Rootmetrics (archived copy). Accessed 4/25/2018.
- “OpenSignal data is collected from regular consumer smartphones and recorded under conditions of normal usage. As opposed to drive-test data, which simulates the typical user experience by employing a limited set of devices in a small number of locations, we take our measurements from millions of smartphones owned by normal people who have downloaded the OpenSignal app.”
OpenSignal Methodology (archived copy). Accessed 4/11/2018. - A 2017 blog post from T-Mobile CTO Neville Ray takes an entertaining dive into this topic.
“In the end, Verizon’s still trying to cling to their glory days. That is, the days when their network was still top dog, the days before everyone had a smartphone in their pocket that could measure network performance better than any consultant.”
Paid Consultants vs Real Consumers. Who do you believe? | T-Mobile (archived copy). Accessed 4/11/2018. - In its August 2017 report on U.S. carriers (the most recent report available at the time of writing), Opensignal reported that T-Mobile was the nationwide winner on all six of its performance metrics. Note that other carriers sometimes outperformed T-Mobile in individual regions.
State of Mobile Networks: USA (August 2017) | OpenSignal (archived copy). Accessed 4/11/2018. - Archived here.
- Sprint Network webpage (archived copy) Accessed 4/25/2018.
- “Reliability claim based on Sprint’s analysis of latest Nielsen drive test data for average network reliability (voice & data) in top 106 markets.”
Sprint Network webpage (archived copy) Accessed 4/25/2018. - There’s some discussion of this ad in a post by Michael Crider at Android Police.
- The filing presents three maps side-by-side including a similar map comparing T-Mobile and Sprint. See slide 4 of Attachment C (archived copy).
