FCC Reveals Misleading Coverage Claims

On Wednesday, the FCC released a fascinating report related to the Mobility Fund Phase II (MF-II). The MF-II is a planned program to provide federal funding for network build-outs in rural areas that are underserved by 4G coverage.

To determine which geographic areas were underserved, the FCC requested coverage maps and data from network operators. After reviewing the data and allowing outside entities to challenge the datas’ reliability, the FCC became concerned about the accuracy of the information shared by T-Mobile, U.S. Cellular, and Verizon. The FCC decided to conduct its own performance tests and compare the results of its tests to the information the network operators provided. Here’s what the agency found:1

Through the investigation, staff discovered that the MF-II coverage maps submitted by Verizon, U.S. Cellular, and T-Mobile likely overstated each provider’s actual coverage and did not reflect on-the-ground performance in many instances. Only 62.3% of staff drive tests achieved at least the minimum download speed predicted by the coverage maps—with U.S. Cellular achieving that speed in only 45.0% of such tests, T-Mobile in 63.2% of tests, and Verizon in 64.3% of tests…In addition, staff was unable to obtain any 4G LTE signal for 38% of drive tests on U.S. Cellular’s network, 21.3% of drive tests on T-Mobile’s network, and 16.2% of drive tests on Verizon’s network, despite each provider reporting coverage in the relevant area.

Incentives

When considering the accuracy of coverage maps, I try to think about the incentives network operators face. When advertising to consumers, network operators often have an incentive to overstate the extent of their coverage. However, incentives can run in the opposite direction in other situations. For example, when trying to get approval for a merger between Sprint and T-Mobile, Sprint had incentives to make its 4G coverage profile look limited and inferior to the coverage profiles of other nationwide networks.2

I’m not well-informed about the MF-II, so I don’t feel like I have a good grasp of all the incentives at play. That said, it’s not clear that all network operators would have an incentive to overstate their coverage. A network operator that claimed to offer coverage in an area it didn’t cover may limit competitors’ access to subsidies in that area. However, a network operator erroneously claiming to cover an area may prevent itself from receiving subsidies in that area.

Challenges

After network operators submitted coverage information to the FCC, a number of entities, including both governments and network operators, were allowed to challenge the validity of coverage information submitted by others. Here’s a bit more detail about the challenge process:3

After release of the map of presumptively eligible areas, mobile service providers, state, local, and Tribal government entities, and other interested parties granted a waiver were eligible to submit challenges in the challenge process via an online system operated by USAC. Challengers that requested access to the USAC MF-II Challenge Portal were able to access the provider-specific coverage maps, after agreeing to keep the coverage data confidential, and to file challenges to providers’ coverage claims by submitting speed test data. Challengers were required to conduct speed tests pursuant to a number of standard parameters using specific testing methods on the providers’ pre-approved handset models. The Commission adopted the requirement that challengers use one of the handsets specified by the provider primarily to avoid inaccurate measurements resulting from the use of an unsupported or outdated device—e.g., a device that does not support all of the spectrum bands for which the provider has deployed 4G LTE…During the eight-month challenge window, 106 entities were granted access to the MF-II Challenge Portal. Of the 106 entities granted access to the MF-II Challenge Portal, 38 were mobile service providers required to file Form 477 data, 19 were state government entities, 27 were local government entities, 16 were Tribal government entities, and six were other entities that filed petitions requesting, and were each granted, a waiver to participate.

About a fifth of the participating entities went on to submit challenges:4

21 challengers submitted 20.8 million speed tests across 37 states.

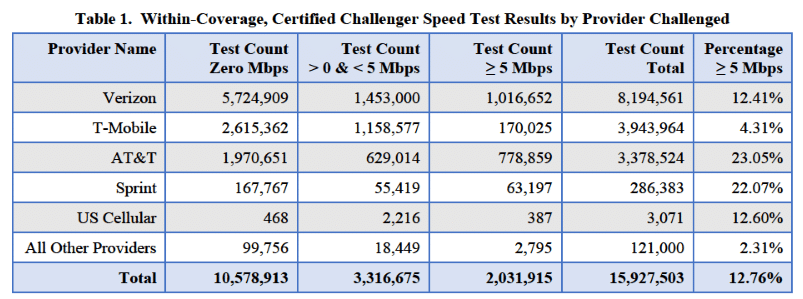
The challenge data often showed failed tests and lackluster speeds in areas where network operators claimed to offer coverage:5

During the challenge process, some parties entered specific concerns into the record. For example:6

Smith Bagley (d/b/a Cellular One) submitted maps of its service area in Arizona overlaid with Verizon’s publicly-stated 4G LTE coverage and the preliminary results of drive tests that Smith Bagley had conducted. Smith Bagley asserted that, for large stretches of road in areas where Verizon reported coverage, its drive testers recorded no 4G LTE signal on Verizon’s network. Smith Bagley argued that the ‘apparent scope of Verizon’s inaccurate data and overstated coverage claims is so extensive that, as a practical matter, the challenge process will not and cannot produce the necessary corrections.’
As part of a public report detailing its experience, Vermont published a map showing its speed test results which contradicted the coverage maps in Vermont of U.S. Cellular, T-Mobile, and Verizon, among others. This map included information on the approximately 187,000 speed tests submitted by Vermont, including download speed, latency, and signal strength. In the report, Vermont detailed that 96% of speed tests for U.S. Cellular, 77% for T-Mobile, and 55% for Verizon failed to receive download speeds of at least 5 Mbps.

After reviewing the challenges, the FCC requested additional information from the five largest network operators (AT&T, T-Mobile, Verizon, Sprint, and U.S. Cellular) to understand the assumptions involved in the networks’ coverage models.

FCC tests

Around the same time the FCC was requesting additional information from network operators, the agency also began its own testing of Verizon, U.S. Cellular, and T-Mobile’s networks. These speed tests took place in 12 states and primarily made use of a drive-testing methodology. As mentioned earlier, analyses of the FCC’s test data suggested that the on-the-ground experience with Verizon, T-Mobile, and U.S. Cellular’s network was much different than the experience that would be expected based on the information the networks provided to the FCC.

What happened?

A lot of the commentary and news articles I’ve seen in response to the FCC’s report seem to conclude that network operators are bullshitters that intentionally lied about the extent of their coverage. I have reservations about fully accepting that conclusion. Accurately modeling coverage is difficult. Lots of factors affect the on-the-ground experience of wireless subscribers. The FCC largely acknowledges this reality in its report:

Providers were afforded flexibility to use the parameters that they used in their normal course of business when parameters were not specified by the Commission. For example, the Commission did not specify fading statistics or clutter loss values, and providers were required to model these factors as they would in the normal course of business.7
Our speed testing, data analyses, and inquiries, however, suggest that some of these differences may be the result of some providers’ models: (1) using a cell edge RSRP value that was too low, (2) not adequately accounting for network infrastructure constraints, including backhaul type and capacity, or (3) not adequately modeling certain on-the-ground factors—such as the local clutter, terrain, and propagation characteristics by spectrum band for the areas claimed to be covered.8

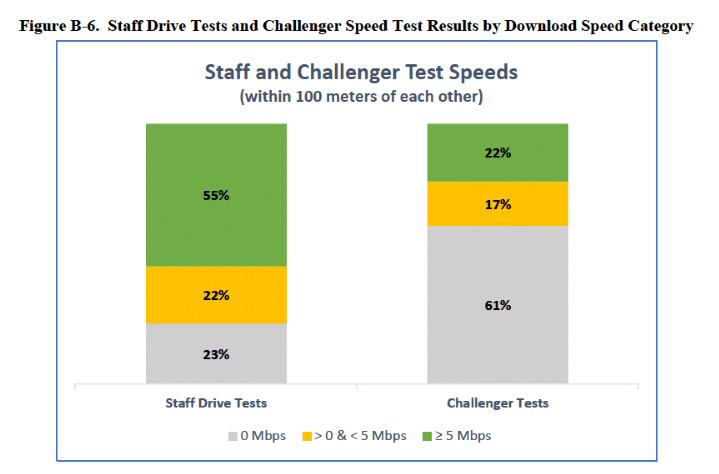
Further supporting the idea that assessing coverage is difficult, the FCC didn’t just find that its tests contradicted the initial information submitted by network operators. The FCC data also contradicted the data submitted by those who challenged network operators’ data:

The causes of the large differences in measured download speed between staff and challenger speed tests taken within the same geographic areas, as well as the high percentage of tests with a download speed of zero in the challenger data, are difficult to determine. Discrepancies may be attributable to differences in test methodologies, network factors at the time of test, differences in how speed tet apps or drive test software process data, or other factors…Given the large differences between challenger and staff results however, we are not confident that individual challenger speed test results provide an accurate representation of the typical consumer on-the-ground experience.9

While the FCC found some of the information submitted by networks to be misleading about on-the-ground service quality, I don’t believe it ended up penalizing any network operators or accusing them of anything too serious.10 Still, the FCC did suggest that some of the network operators could have done better:

Staff engineers, however, found that AT&T’s adjustments to its model to meet the MF-II requirements may have resulted in a more realistic projection of where consumers could receive mobile broadband. This suggests that standardization of certain specifications across the largest providers could result in coverage maps with improved accuracy. Similarly, the fact that AT&T was able to submit coverage data that appear to more accurately reflect MF-II coverage requirements raises questions about why other providers did not do so. And while it is true that MF-II challengers submitted speed tests contesting AT&T’s coverage data, unlike for other major providers, no parties alleged in the record that AT&T’s MF-II coverage data were significantly overstated.11

FCC response

The FCC concluded that it should make some changes to its processes:12

First, the Commission should terminate the MF-II Challenge Process. The MF-II coverage maps submitted by several providers are not a sufficiently reliable or accurate basis upon which to complete the challenge process as it was designed.
Second, the Commission should release an Enforcement Advisory on broadband deployment data submissions, including a detailing of the penalties associated with filings that violate federal law, both for the continuing FCC Form 477 filings and the new Digital Opportunity Data Collection. Overstating mobile broadband coverage misleads the public and can misallocate our limited universal service funds.
Third, the Commission should analyze and verify the technical mapping data submitted in the most recent Form 477 filings of Verizon, U.S. Cellular, and T-Mobile to determine whether they meet the Form 477 requirements. Staff recommends that the Commission assemble a team with the requisite expertise and resources to audit the accuracy of mobile broadband coverage maps submitted to the Commission. The Commission should further consider seeking appropriations from Congress to carry out drive testing, as appropriate.
Fourth, the Commission should adopt policies, procedures, and standards in the Digital Opportunity Data Collection rulemaking and elsewhere that allow for submission, verification, and timely publication of mobile broadband coverage data. Mobile broadband coverage data specifications should include, among other parameters, minimum reference signal received power (RSRP) and/or minimum downlink and uplink speeds, standard cell loading factors and cell edge coverage probabilities, maximum terrain and clutter bin sizes, and standard fading statistics. Providers should be required to submit actual on-the-ground evidence of network performance (e.g., speed test measurement samplings, including targeted drive test and stationary test data) that validate the propagation model used to generate the coverage maps. The Commission should consider requiring that providers assume the minimum values for any additional parameters that would be necessary to accurately determine the area where a handset should achieve download and upload speeds no less than the minimum throughput requirement for any modeling that includes such a requirement.

Reflections

The FCC’s report illustrates how hard it is to assess network performance. Assumptions must be made in coverage models, and the assumptions analysts choose to make can have substantial effects on the outputs of their models. Similarly, on-the-ground performance tests don’t always give simple-to-interpret results. Two entities can run tests in the same area and find different results. Factors like the time of day a test was conducted or the type of device that was used in a test can have big consequences.

If we want consumers to have better information about the quality of service networks can offer, we need entities involved in modeling and testing coverage to be transparent about their methodologies.

PCMag’s 2019 Network Tests — My thoughts

Summary

On June 20, PCMag published its latest results from performance testing on the major U.S. wireless networks. Surprisingly, AT&T rather than Verizon took the top spot in the overall rankings. I expect this was because PCMag places far more weight on network performance within cities than performance in less-populated areas.

In my opinion, PCMag’s methodology overweights average upload and download speeds at the expense of network reliability. Despite my qualms, I found the results interesting to dig into. PCMag deserves a lot of credit for its thoroughness and unusual level of transparency.

Testing methodology

PCMag claims to be more transparent about its methodology than other entities that evaluate wireless networks.1 I’ve found this to be true. PCMag’s web page covering its methodology is detailed. Sascha Segan, the individual who leads the testing, quickly responded to my questions with detailed answers. I can’t say anything this positive about transparency demonstrated by RootMetrics or OpenSignal.

To measure network performance, PCMag used custom speed test software developed by Ookla. The software was deployed on Samsung Galaxy S10 phones that were driven to 30 U.S. cities as they collected data.2 In each city, stops were made in several locations for additional data collection. PCMag only recorded performance on LTE networks. If a phone was connected to a non-LTE network (e.g., a 3G network) during a test, the phone would fail that test.3 PCMag collected data on six metrics:4

  • Average download speed
  • Percent of downloads over a 5Mbps speed threshold
  • Average upload speed
  • Percent of uploads over a 2Mbps speed threshold
  • Reliability (percent of the time a connection was available)
  • Latency

The Galaxy S10 is a recent, flagship device and has essentially the best technology available for high-performance on LTE networks. Accordingly, PCMag’s test are likely to show better performance than consumers using lower-end devices will experience. PCMag’s decision to use the same high-performance device on all networks may prevent selection bias that sometimes creeps up in crowdsourced data when subscribers on one network tend to use different devices than subscribers on another network.5

In my opinion, PCMag’s decision not to account for performance on non-LTE networks somewhat limits the usefulness of its results. Some network operators still use a lot of non-LTE technologies.

Scoring

PCMag accounts for networks’ performance on several different metrics. To arrive at overall rankings, PCMag gives networks a score for each metric and assigns specific weights to each metric. Scoring multiple metrics and reasonably assigning weights is far trickier than most people realize. A lot of evaluation methodologies lose their credibility during this process (see Beware of Scoring Systems).

PCMag shares this pie chart when describing the weights assigned to each metric:6

The pie chart doesn’t tell the full story. For each metric, PCMag gives the best-performing network all the points available for that metric. Other networks are scored based on how far they are away from the best-performing network. For example, if the best-performing network has an average download speed of 100Mbps (a great speed), it will get 100% of the points available for average download speed. Another network with an average speed of 60Mbps (a good speed) would get 60% of the points available for average download speed.

The importance of a metric is determined not just by the weight it’s assigned. The variance in a metric is also extraordinarily important. PCMag measures reliability in terms of how often a phone has an LTE connection. Reliability has low variance. 100% reliability indicates great coverage (i.e., a connection is always available). 80% reliability is bad. Networks’ reliability barely affects PCMag’s rankings since reliability measures are fairly close to 100% even on unreliable networks.

The scoring system is sensitive to how reliability numbers are presented. Imagine there are only two networks:

  • Network A with 99% reliability
  • Network B with 98% reliability

Using PCMag’s approach, both network A and B would get a very similar number of points for reliability. However, it’s easy to change how the same metric is presented:

  • Network A has no connection 1% of the time
  • Network B has no connection 2% of the time

If PCMag put the reliability metric in this format, network B would only get half of the points available for reliability.

As a general rule, I think average speed metrics are hugely overrated. It’s important that speeds are good enough for people to do what they want to do on their phones. Having speeds that are way faster than the minimum speed that’s sufficient won’t benefit people much.

I’m glad that PCMag put some weight on reliability and on the proportion of tests that exceeded fairly minimum upload and download speed thresholds. However, these metrics just don’t have nearly as much of an effect on PCMag’s final results as I think they should. The scores for Chicago provide a good illustration:

Despite having the worst reliability score and by far the worst score for downloads above a 5Mbps threshold, T-Mobile still manages to take the top ranking. Without hesitation, I’d choose service with Verizon or AT&T’s performance in Chicago over service with T-Mobile’s performance in Chicago. (If you’d like to get a better sense of how scores for different metrics drove the results in Chicago, see this Google sheet where I’ve reverse engineered the scoring.)

To create rankings for regions and final rankings for the nation, PCMag combines city scores and scores for suburban/rural areas. As I understand it, PCMag mostly collected data in cities, and roughly 20% of the overall weight is placed on data from rural/suburban areas. Since a lot more than 20% of the U.S. population lives in rural or suburban areas, one could argue the national results overrepresent performance in cities. I think this puts Verizon at a serious disadvantage in the rankings. Verizon has more extensive coverage than other networks in sparsely populated areas.

While I’ve been critical in this post, I want to give PCMag the credit it’s due. First, the results for each metric in individual cities are useful and interesting. It’s a shame that many people won’t go that deep into the results and will instead walk away with the less-useful conclusion that AT&T took the top spot in the national rankings.

PCMag also deserves credit for not claiming that its results are the be-all-end-all of network evaluation:7

Other studies may focus on downloads, or use a different measurement of latency, or (in Nielsen’s case) attempt to measure the speeds coming into various mobile apps. We think our balance makes the most sense, but we also respect the different decisions others have made.

RootMetrics and OpenSignal are far less modest.

Network Evaluation Should Be Transparent

Several third-party firms collect data on the performance of U.S. wireless networks. Over the last few months, I’ve tried to dig deeply into several of these firms’ methodologies. In every case, I’ve found the public-facing information to be inadequate. I’ve also been unsuccessful when reaching out to some of the firms for additional information.

It’s my impression that evaluation firms generally make most of their money by selling data access to network operators, analysts, and other entities that are not end consumers. If this was all these companies did with their data, I would understand the lack of transparency. However, most of these companies publish consumer-facing content. Often this takes the form of awards granted to network operators that do well in evaluations. It looks like network operators regularly pay third-party evaluators for permission to advertise the receipt of awards. I wish financial arrangements between evaluators and award winners were a matter of public record, but that’s a topic for another day. Today, I’m focusing on the lack of transparency around evaluation methodologies.

RootMetrics collects data on several different aspects of network performance and aggregates that data to form overall scores for each major network. How exactly does RootMetrics do that aggregation?

The results are converted into scores using a proprietary algorithm.1

I’ve previously written about how difficult it is to combine data on many aspects of a product or service to arrive at a single, overall score. Beyond that, there’s good evidence that different analysts working in good faith with the same raw data often make different analytical choices that lead to substantive differences in the results of their analyses. I’m not going take it on faith that RootMetrics’ proprietary algorithm aggregates data in a highly-defensible manner. No one else should either.

Opensignal had a long history of giving most of its performance awards to T-Mobile.2 Earlier this year, the trend was broken when Verizon took Opensignal’s awards in most categories.3 It’s not clear why Verizon suddenly became a big winner. The abrupt change strikes me as more likely to have been driven by a change in methodology than a genuine change in the performance of networks relative to one another. Since little is published about Opensignal’s methodology, I can’t confirm or disconfirm my speculation. In Opensignal’s case, questions about methodology are not trivial. There’s good reason to be concerned about possible selection bias in Opensignal’s analyses. Opensignal’s Analytics Charter states:4

Our analytics are designed to ensure that each user has an equal impact on the results, and that only real users are counted: ‘one user, one vote’.

Carriers will differ in the proportion of their subscribers that live in rural areas versus densely-populated areas. If the excerpt from the analytics charter is taken literally, it may suggest that Opensignal does not control for differences in subscribers’ geography or demographics. That could explain why T-Mobile has managed to win so many Opensignal awards when T-Mobile obviously does not have the best-performing network at the national level.

Carriers advertise awards from evaluators because third-parties are perceived to be credible. The public deserves to have enough information to assess whether third-party evaluators merit that credibility.

The Optimizer’s Curse & Wrong-Way Reductions

I recommend reading this post on my personal blog instead of this page.1


Following an idea to its logical conclusion might be extrapolating a model beyond its valid range.John D. Cook

Summary

I spent about two and a half years as a research analyst at GiveWell. For most of my time there, I was the point person on GiveWell’s main cost-effectiveness analyses. I’ve come to believe there are serious, underappreciated issues with the methods the effective altruism (EA) community at large uses to prioritize causes and programs. While effective altruists approach prioritization in a number of different ways, most approaches involve (a) roughly estimating the possible impacts funding opportunities could have and (b) assessing the probability that possible impacts will be realized if an opportunity is funded.

I discuss the phenomenon of the optimizer’s curse: when assessments of activities’ impacts are uncertain, engaging in the activities that look most promising will tend to have a smaller impact than anticipated. I argue that the optimizer’s curse should be extremely concerning when prioritizing among funding opportunities that involve substantial, poorly understood uncertainty. I further argue that proposed Bayesian approaches to avoiding the optimizer’s curse are often unrealistic. I maintain that it is a mistake to try and understand all uncertainty in terms of precise probability estimates.

This post is long, so I’ve separated it into several sections:

  1. The optimizer’s curse
  2. Models, wrong-way reductions, and probability
  3. Hazy probabilities and prioritization
  4. Bayesian wrong-way reductions
  5. Doing better

Part 1: The optimizer’s curse

The counterintuitive phenomenon of the optimizer’s curse was first formally recognized in Smith & Winkler 2006.

Here’s a rough sketch:

  • Optimizers start by calculating the expected value of different activities.
  • Estimates of expected value involve uncertainty.
  • Sometimes expected value is overestimated, sometimes expected value is underestimated.
  • Optimizers aim to engage in activities with the highest expected values.
  • Result: Optimizers tend to select activities with overestimated expected value.

Smith and Winkler refer to the difference between the expected value of an activity and its realized value as “postdecision surprise.”

The optimizer’s curse occurs even in scenarios where estimates of expected value are unbiased (roughly, where any given estimate is as likely to be too optimistic as it is to be too pessimistic2). When estimates are biased—which they typically are in the real world—the magnitude of the postdecision surprise may increase.

A huge problem for effective altruists facing uncertainty

In a simple model, I show how an optimizer with only moderate uncertainty about factors that determine opportunities’ cost-effectiveness may dramatically overestimate the cost-effectiveness of the opportunity that appears most promising. As uncertainty increases, the degree to which the cost-effectiveness of the optimal-looking program is overstated grows wildly.

I believe effective altruists should find this extremely concerning. They’ve considered a large number of causes. They often have massive uncertainty about the true importance of causes they’ve prioritized. For example, GiveWell acknowledges substantial uncertainty about the impact of deworming programs it recommends, and the Open Philanthropy Project pursues a high-risk, high-reward grantmaking strategy.

The optimizer’s curse can show up even in situations where effective altruists’ prioritization decisions don’t involve formal models or explicit estimates of expected value. Someone informally assessing philanthropic opportunities in a linear manner might have a thought like:

Thing X seems like an awfully big issue. Funding Group A would probably cost only a little bit of money and have a small chance leading to a solution for Thing X. Accordingly, I feel decent about the expected cost-effectiveness of funding Group A.

Let me compare that to how I feel about some other funding opportunities…

Although the thinking is informal, there’s uncertainty, potential for bias, and an optimization-like process.3

Previously proposed solution

The optimizer’s curse hasn’t gone unnoticed by impact-oriented philanthropists. Luke Muehlhauser, a senior research analyst at the Open Philanthropy Project and the former executive director of the Machine Intelligence Research Institute, wrote an article titled The Optimizer’s Curse and How to Beat It. Holden Karnofsky, the co-founder of GiveWell and the CEO of the Open Philanthropy Project, wrote Why we can’t take expected value estimates literally. While Karnofsky didn’t directly mention the phenomenon of the optimizer’s curse, he covered closely related concepts.

Both Muehlhauser and Karnofsky suggested that the solution to the problem is to make Bayesian adjustments. Muehlhauser described this solution as “straightforward.”4 Karnofsky seemed to think Bayesian adjustments should be made, but he acknowledged serious difficulties involved in making explicit, formal adjustments.5 Bayesian adjustments are also proposed in Smith & Winkler 2006.6

Here’s what Smith & Winkler propose (I recommend skipping it if you’re not a statistics buff):7

“The key to overcoming the optimizer’s curse is conceptually quite simple: model the uncertainty in the value estimates explicitly and use Bayesian methods to interpret these value estimates. Specifically, we assign a prior distribution on the vector of true values μ=(μ1,…,μn) and describe the accuracy of the value estimates V = (V1,…,Vn) by a conditional distribution V|μ. Then, rather than ranking alternatives based on the value estimates, after we have done the decision analysis and observed the value estimates V, we use Bayes’ rule to determine the posterior distribution for μ|V and rank and choose among alternatives based on the posterior means, i = E[μi|V] for i = 1,…,n.”

For entities with lots of past data on both the (a) expected values of activities and (b) precisely measured, realized values of the same activities, this may be an excellent solution.

In most scenarios where effective altruists encounter the optimizer’s curse, this solution is unworkable. The necessary data doesn’t exist.8 The impact of most philanthropic programs has not been rigorously measured. Most funding decisions are not made on the basis of explicit expected value estimates. Many causes effective altruists are interested in are novel: there have never been opportunities to collect the necessary data.

The alternatives I’ve heard effective altruists propose involve attempts to approximate data-driven Bayesian adjustments as well as possible given the lack of data. I believe these alternatives either don’t generally work in practice or aren’t worth calling Bayesian.

To make my case, I’m going to first segue into some other topics.

Part 2: Models, wrong-way reductions, and probability

Models

In my experience, members of the effective altruism community are far more likely than the typical person to try to understand the world (and make decisions) on the basis of abstract models.9 I don’t think enough effort goes into considering when (if ever) these abstract models cease to be appropriate for application.

This post’s opening quote comes from a great blog post by John D Cook. In the post, Cook explains how Euclidean geometry is a great model for estimating the area of a football field—multiply field_length * field_width and you’ll get a result that’s pretty much exactly the field’s area. However, Euclidean geometry ceases to be a reliable model when calculating the area of truly massive spaces—the curvature of the earth gets in the way.10 Most models work the same way. Here’s how Cook ends his blog post:11

Models are based on experience with data within some range. The surprising thing about Newtonian physics is not that it breaks down at a subatomic scale and at a cosmic scale. The surprising thing is that it is usually adequate for everything in between.

Most models do not scale up or down over anywhere near as many orders of magnitude as Euclidean geometry or Newtonian physics. If a dose-response curve, for example, is linear for observations in the range of 10 to 100 milligrams, nobody in his right mind would expect the curve to remain linear for doses up to a kilogram. It wouldn’t be surprising to find out that linearity breaks down before you get to 200 milligrams.

Wrong-way reductions

In a brilliant article, David Chapman coins the term “wrong-way reduction” to describe an error people commit when they propose tackling a complicated, hard problem with an apparently simple solution that, on further inspection, turns out to be more problematic than the initial problem. Chapman points out that regular people rarely make this kind of error. Usually, wrong-way reductions are motivated errors committed by people in fields like philosophy, theology, and cognitive science.

The problematic solutions wrong-way reductions offer often take this form:


“If we had [a thing we don’t usually have], then we could [apply a simple strategy] to authoritatively solve all instances of [a hard problem].”


People advocating wrong-way reductions often gloss over the fact that their proposed solutions require something we don’t have or engage in intellectual gymnastics to come up with something that can act as a proxy for the thing we don’t have. In most cases, these intellectual gymnastics strike outsiders as ridiculous but come off more convincing to people who’ve accepted the ideology that motivated the wrong-way reduction.

A wrong-way reduction is often an attempt to universalize an approach that works in a limited set of situations. Put another way, wrong-way reductions involve stretching a model way beyond the domains it’s known to work in.

An example

I spent a lot of my childhood in evangelical, Christian communities. Many of my teachers and church leaders subscribed to the idea that the Bible was the literal, infallible word of God. If you presented some of these people with questions about how to live or how to handle problems, they’d encourage you to turn to the Bible.12

In some cases, the Bible offered fairly clear guidance. When faced with the question of whether one should worship the Judeo-Christian God, the commandment, “You shall have no other gods before me”13 gives a clear answer. Other parts of the Bible are consistent with that commandment. However, “follow the Bible” ends up as a wrong-way reduction because the Bible doesn’t give clear answers to most of the questions that fall under the umbrella of “How should one live?”

Is abortion OK? One of the Ten Commandments states, “You shall not murder.”14 But then there are other passages that advocate execution.15 How similar are abortion, execution, and murder anyway?

Should one continue dating a significant other? Start a business? It’s not clear where to start with those questions.

I intentionally used an example that I don’t think will ruffle too many readers’ feathers, but imagine for a minute what it’s like to be a person who subscribes to the idea that the Bible is a complete and infallible guide:

You see the hard problem of deciding how to live has a demanding but straightforward solution! You frequently observe people—including plenty of mainstream Christians— experience failure and suffering when their actions don’t align with the Bible’s teachings.

You’re likely in a close-knit community with like-minded people. Intelligent and respected members of the community regularly turn to the Bible for advice and encourage you to do the same.

When you have doubts about the coherence of your worldview, there’s someone smarter than you in the church community you can consult. The wise church member has almost certainly heard concerns similar to yours before and can explain why the apparent issues or inconsistencies you’ve run into may not be what they seem.

A mainstream Christian from outside the community probably wouldn’t find the rationales offered by the church member compelling. An individual who’s already in the community is more easily convinced.16

Probability

The idea that all uncertainty must be explainable in terms of probability is a wrong-way reduction. Getting more detailed, the idea that if one knows the probabilities and utilities of all outcomes, then she can always behave rationally in pursuit of her goals is a wrong-way reduction.

It’s not a novel proposal. People have been saying versions of this for a long time. The term Knightian uncertainty is often used to distinguish quantifiable risk from unquantifiable uncertainty.

As I’ll illustrate later, we don’t need to assume a strict dichotomy separates quantifiable risks from unquantifiable risks. Instead, real-world uncertainty falls on something like a spectrum.

Nate Soares, the executive director of the Machine Intelligence Research Institute, wrote a post on LessWrong that demonstrates the wrong-way reduction I’m concerned about. He writes:17

It doesn’t really matter what uncertainty you call ‘normal’ and what uncertainty you call ‘Knightian’ because, at the end of the day, you still have to cash out all your uncertainty into a credence so that you can actually act.

I don’t think ignorance must cash out as a probability distribution. I don’t have to use probabilistic decision theory to decide how to act.

Here’s the physicist David Deutsch tweeting on a related topic:

What is probability?

Probability is, as far as we know, an abstract mathematical concept. It doesn’t exist in the physical world of our everyday experience.18 However, probability has useful, real-world applications. It can aid in describing and dealing with many types of uncertainty.

I’m not a statistician or a philosopher. I don’t expect anyone to accept that position based on my authority. That said, I believe I’m in good company. Here’s an excerpt from Bayesian statistician Andrew Gelman on the same topic:19

Probability is a mathematical concept. To define it based on any imperfect real-world counterpart (such as betting or long-run frequency) makes about as much sense as defining a line in Euclidean space as the edge of a perfectly straight piece of metal, or as the space occupied by a very thin thread that is pulled taut. Ultimately, a line is a line, and probabilities are mathematical objects that follow Kolmogorov’s laws. Real-world models are important for the application of probability, and it makes a lot of sense to me that such an important concept has many different real-world analogies, none of which are perfect.

Consider a handful of statements that involve probabilities:


  1. A hypothetical fair coin tossed in a fair manner has a 50% chance of coming up heads.

  2. When two buddies at a bar flip a coin to decide who buys the next round, each person has a 50% chance of winning.

  3. Experts believe there’s a 20% chance the cost of a gallon of gasoline will be higher than $3.00 by this time next year.

  4. Dr. Paulson thinks there’s an 80% chance that Moore’s Law will continue to hold over the next 5 years.

  5. Dr. Johnson thinks there’s a 20% chance quantum computers will commonly be used to solve everyday problems by 2100.

  6. Kyle is an atheist. When asked what odds he places on the possibility that an all-powerful god exists, he says “2%.”

I’d argue that the degree to which probability is a useful tool for understanding uncertainty declines as you descend the list.

  • The first statement is tautological. When I describe something as “fair,” I mean that it perfectly conforms to abstract probability theory.
  • In the early statements, the probability estimates can be informed by past experiences with similar situations and explanatory theories.
  • In the final statement, I don’t know what to make of the probability estimate.

The hypothetical atheist from the final statement, Kyle, wouldn’t be able to draw on past experiences with different realities (i.e., Kyle didn’t previously experience a bunch of realities and learn that some of them had all-powerful gods while others didn’t). If you push someone like Kyle to explain why they chose 2% rather than 4% or 0.5%, you almost certainly won’t get a clear explanation.

If you gave the same “What probability do you place on the existence of an all-powerful god?” question to a number of self-proclaimed atheists, you’d probably get a wide range of answers.20

I bet you’d find that some people would give answers like 10%, others 1%, and others 0.001%. While these probabilities can all be described as “low,” they differ by orders of magnitude. If probabilities like these are used alongside probabilistic decision models, they could have extremely different implications. Going forward, I’m going to call probability estimates like these “hazy probabilities.”

Placing hazy probabilities on the same footing as better-grounded probabilities (e.g., the odds a coin comes up heads) can lead to problems.

Part 3: Hazy probabilities and prioritization

Probabilities that feel somewhat hazy show up frequently in prioritization work that effective altruists engage in. Because I’m especially familiar with GiveWell’s work, I’ll draw on it for an illustrative example.21 GiveWell’s rationale for recommending charities that treat parasitic worm infections hinges on follow-ups to a single study. Findings from these follow-ups are suggestive of large, long-term income gains for individuals that received deworming treatments as children.22

There were a lot of odd things about the study that make extrapolating to form expectations about the effect of deworming in today’s programs difficult.23 To arrive at a bottom-line estimate of deworming’s cost-effectiveness, GiveWell assigns explicit, numerical values in multiple hazy-feeling situations. GiveWell faces similar haziness when modeling the impact of some other interventions it considers.24

While GiveWell’s funding decisions aren’t made exclusively on the basis of its cost-effectiveness models, they play a significant role. Haziness also affects other, less-quantitative assessments GiveWell makes when deciding what programs to fund. That said, the level of haziness GiveWell deals with is minor in comparison to what other parts of the effective altruism community encounter.

Hazy, extreme events

There are a lot of earth-shattering events that could happen and revolutionary technologies that may be developed in my lifetime. In most cases, I would struggle to place precise numbers on the probability of these occurrences.

Some examples:

  • A pandemic that wipes out the entire human race
  • An all-out nuclear war with no survivors
  • Advanced molecular nanotechnology
  • Superhuman artificial intelligence
  • Catastrophic climate change that leaves no survivors
  • Whole-brain emulations
  • Complete ability to stop and reverse biological aging
  • Eternal bliss that’s granted only to believers in Thing X

You could come up with tons more.

I have rough feelings about the plausibility of each scenario, but I would struggle to translate any of these feelings into precise probability estimates. Putting probabilities on these outcomes seems a bit like the earlier example of an atheist trying to precisely state the probability he or she places on a god’s existence.

If I force myself to put numbers on things, I have thoughts like this:

Maybe whole-brain emulations have a 1 in 10,000 chance of being developed in my lifetime. Eh, on second thought, maybe 1 in 100. Hmm. I’ll compromise and say 1 in 1,000.

An effective altruist might make a bunch of rough judgments about the likelihood of scenarios like those above, combine those probabilities with extremely hazy estimates about the impact she could have in each scenario and then decide which issue or issues should be prioritized. Indeed, I think this is more or less what the effective altruism community has done over the last decade.

When many hazy assessments are made, I think it’s quite likely that some activities that appear promising will only appear that way due to ignorance, inability to quantify uncertainty, or error.

Part 4: Bayesian wrong-way reductions

I believe the proposals effective altruists have made for salvaging general, Bayesian solutions to the optimizer’s curse are wrong-way reductions.

To make a Bayesian adjustment, it’s necessary to have a prior (roughly, a probability distribution that captures initial expectations about a scenario). As I mentioned earlier, effective altruists will rarely have the information necessary to create well-grounded, data-driven priors. To get around the lack of data, people propose coming up with priors in other ways.

For example, when there is serious uncertainty about the probabilities of different outcomes, people sometimes propose assuming that each possible outcome is equally probable. In some scenarios, this is a great heuristic.25 In other situations, it’s a terrible approach.26 To put it simply, a state of ignorance is not a probability distribution.

Karnofsky suggests a different approach (emphasis mine):27

It’s my view that my brain instinctively processes huge amounts of information, coming from many different reference classes, and arrives at a prior; if I attempt to formalize my prior, counting only what I can name and justify, I can worsen the accuracy a lot relative to going with my gut…Rather than using a formula that is checkable but omits a huge amount of information, I’d prefer to state my intuition – without pretense that it is anything but an intuition – and hope that the ensuing discussion provides the needed check on my intuitions.

I agree with Karnofsky that we should take our intuitions seriously, but I don’t think intuitions need to correspond to well-defined mathematical structures. Karnofsky maintains that Bayesian adjustments to expected value estimates “can rarely be made (reasonably) using an explicit, formal calculation.” I find this odd, and I think it may indicate that Karnofsky doesn’t really believe his intuitions cash out as priors. To make an explicit, Bayesian calculation, a prior doesn’t need to be well-justified. If one is capable of drawing or describing a prior distribution, a formal calculation can be made.

I agree with many aspects of Karnofsky’s conclusions, but I don’t think what Karnofsky is advocating should be called Bayesian. It’s closer to standard reasonableness and critical thinking in the face of poorly understood uncertainty. Calling Karnofsky’s suggested process “making a Bayesian adjustment” suggests that we have something like a general, mathematical method for critical thinking. We don’t.

Similarly, taking our hunches about the plausibility of scenarios we have a very limited understanding of and treating those hunches like well-grounded probabilities can lead us to believe we have a well-understood method for making good decisions related to those scenarios. We don’t.

Many people have unwarranted confidence in approaches that appear math-heavy or scientific. In my experience, effective altruists are not immune to that bias.

Part 5: Doing better

When discussing these ideas with members of the effective altruism community, I felt that people wanted me to propose a formulaic solution—some way to explicitly adjust expected value estimates that would restore the integrity of the usual prioritization methods. I don’t have any suggestions of that sort.

Below I outline a few ideas for how effective altruists might be able to pursue their goals despite the optimizer’s curse and difficulties involved in probabilistic assessments.

Embrace model skepticism

When models are being pushed outside of the domains where they have been built and tested, caution should be exercised. Especial skepticism should be used in situations where a model is presented as a universal method for handling problems.

Entertain multiple models

If an opportunity looks promising under a number of different models, it’s more likely to be a good opportunity than one that looks promising under a single model.28 It’s worth trying to foster several different mental models for making sense of the world. For the same reason, surveying experts about the value of funding opportunities may be extremely useful. Some experts will operate with different models and thinking styles than I do. Where my models have blind spots, their models may not.

Test models

One of the ways we figure out how far models can reach is through application in varied settings. I don’t believe I have a 50-50 chance of winning a coin flip with a buddy for exclusively theoretical reasons. I’ve experienced a lot of coin flips in my life. I’ve won about half of them. By funding opportunities that involve feedback loops (allowing impact to be observed and measured in the short term), a lot can be learned about how well models work and when probability estimates can be made reliably.

Learn more

When probability assessments feel hazy, the haziness often stems from lack of knowledge about the subject under consideration. Acquiring a deep understanding of a subject may eliminate some haziness.

Position society

Since it isn’t possible to know the probability of all important developments that may happen in the future, it’s prudent to put society in a good position to handle future problems when they arise.29

Acknowledge difficulty

I know the ideas I’m proposing for doing better are not novel or necessarily easy to put into practice. Despite that, recognizing that we don’t have a reliable, universal formula for making good decisions under uncertainty has a lot of value.

In my experience, effective altruists are unusually skeptical of conventional wisdom, tradition, intuition, and similar concepts. Effective altruists correctly recognize deficiencies in decision-making based on these concepts. I hope that they’ll come to accept that, like other approaches, decision-making based on probability and expected value has limitations.


Huge thanks to everyone who reviewed drafts of this post or had conversations with me about these topics over the last few years!

Added 4/6/2019: There’s been discussion and debate about this post over on the Effective Altruism Forum.

Average Download Speed Is Overrated

I’ve started looking into the methodologies used by entities that collect cell phone network performance data. I keep seeing an emphasis on average (or median) download and upload speeds when data-service quality is discussed.

  • Opensignal bases it’s data-experience rankings exclusively on download and upload speeds.1
  • Tom’s Guide appears to account for data-quality using average download and possibly upload speeds.2
  • RootMetrics doesn’t explicitly disclose how it arrives at final data-performance scores, but emphasis is placed on median upload and download speeds.3

It’s easy to understand what average and median speeds represent. Unfortunately, these metrics fail to capture something essential—variance in speeds.

For example, OpenSignal’s latest report for U.S. networks shows that Verizon has the fastest average download speed of 31 Mbps in the Chicago area. AT&T’s average download speed is only 22 Mbps in the same area. Both those speeds are easily fast enough for typical activities on a phone. At 22 Mbps per second, I could stream video, listen to music, or browse the internet seamlessly. For the rare occasion where I download a 100MB file, Verizon’s network at the average speed would beat AT&T’s by about 10.6 seconds.4 Not a big deal for something I do maybe once a month.

On the other hand, variance in download speeds can matter quite a lot. If I have 31 Mbps speeds on average, but I occasionally have sub-1 Mbps speeds, it may sometimes be annoying or impossible to use my phone for browsing and streaming. Periodically having 100+ Mbps speeds would not make up for the inconvenience of sometimes having low speeds. I’d happily accept a modest decrease in average speeds in exchange for a modest decrease in variance.5