
Crowdsourcing Coverage Data
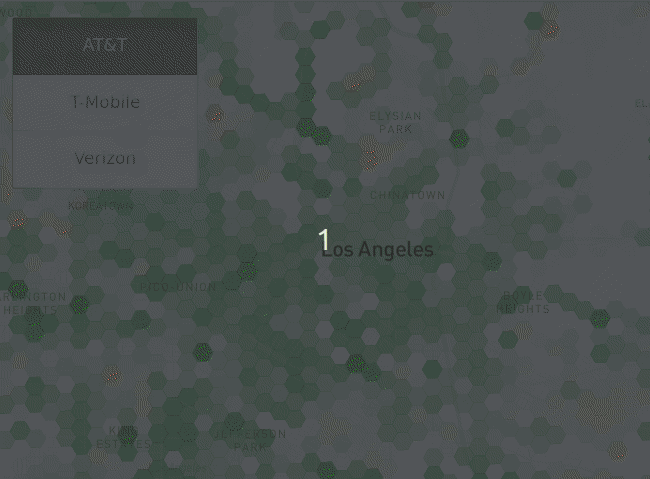
Vehicles with DIMO hardware are driving millions of miles per week and contributing anonymized data to Coverage Critic’s interactive crowdsourced map. Here’s how the new map presents T-Mobile’s coverage around New York City.
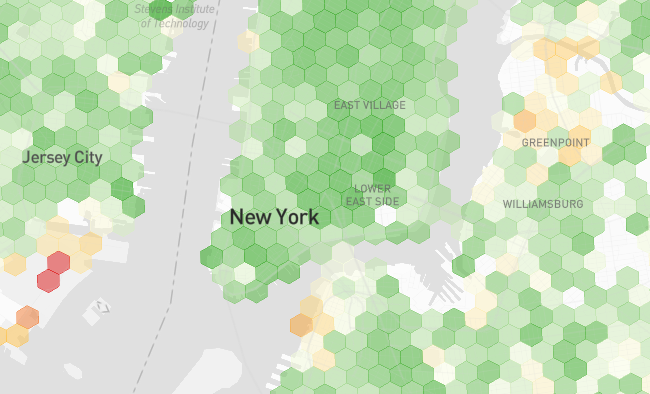
Green shading indicates strong signals. As the signals weaken, the shading morphs to yellow and eventually red.
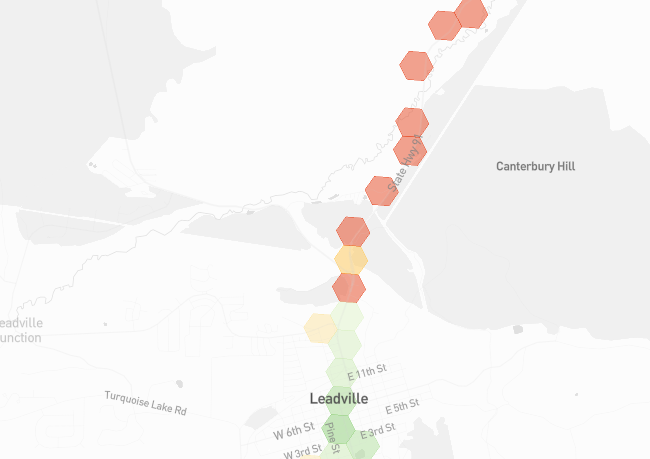
While the map is less complete in remote areas, it’s potentially more interesting. In the heart of the mountain town of Leadville, Colorado, the map shows good coverage from AT&T. Following the highway out of town to the north, signal quality quickly deteriorates.
Today’s map is built on almost 20 million data points. With over a million more observations coming in each day, the map will grow more complete.
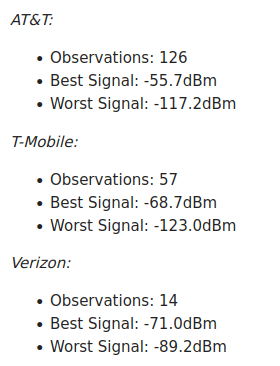
Map users can drill down into the underlying data after selecting a specific region:
More powerful tools for exploring and visualizing the data are coming soon.
Approaches To Network Testing
There are two standard approaches for assessing cell networks:
- Drive Testing: Evaluators drive around with several phones on different networks while running tests to assess cellular performance.
- Conventional Crowdsourcing: Code running in the background of various apps on ordinary consumers’ phones collects data about cell networks.
Pros & Cons
Drive testing is well-controlled. Evaluators use the same device on every network and have detailed information on exactly what’s going on. On the other hand, drive tests assess a limited area and may not reflect real-world usage. RootMetrics, the company behind what is arguably the most respected drive test, covers only a few hundred thousand miles each year.
Conventional crowdsourcing allows for the collection of far more data. However, the data is harder to interpret. Crowdsourced data comes from numerous different devices. It’s often unclear whether a given data point comes from a phone that’s indoors or outdoors. Since consumers aren’t randomly assigned their devices or networks, bias infiltrates assessments.1
Coverage Critic’s New Approach
Coverage Critic’s approach is a hybrid of the two standard approaches to network testing. Like drive tests, Coverage Critic collects data in a relatively well-controlled manner, relying on in-vehicle data from a tightly constrained set of devices. Since data is crowdsourced from thousands of vehicles, more miles are covered in a week than some conventional drive testers cover in a year.2
Enabled By DIMO
Mozilla recently published a bombshell report titled It’s Official: Cars Are the Worst Product Category We Have Ever Reviewed for Privacy. The report details (1) how much data modern vehicles collect and (2) car companies’ tendency to reserve the right to sell that data.
DIMO is reimagining how vehicle data is collected and used, allowing consumers to share in the value of their vehicles’ data while offering more transparency and control over its use.
Thousands of cars driving tens of millions of miles annually are equipped with DIMO hardware and contributing anonymized data to the new map. When Coverage Critic pays DIMO for data, a share of the payments goes towards rewards for the DIMO community. To everyone participating in the project, I’d like to offer my thanks!
The Road Ahead
For the moment, Coverage Critic will offer a coverage map relying on RF modeling data submitted to the FCC’s BDC program and an alternate map based on on-the-ground, crowdsourced data. Eventually, I plan to merge both data sources into a single map.
With an appropriate statistical model, the two data sources can aid one another. Information collected on the ground can be used to forecast the accuracy of networks’ RF models in other locations. Predictions from RF models can inform how likely crowdsourced data is to reflect the typical experience in a given area. In a few months, I’ll have much more to say on this topic.
Go ahead and explore the map. If you have any feedback, please let me know.
Footnotes
- I wrote about this phenomenon in a recent post:
Say a country has two cellular networks. Network A offers coverage nearly everywhere. Network B offers a much smaller coverage footprint. You could crowdsource data from ordinary subscribers on the networks and track what proportion of the time users are connected to their networks.
If you compare the availability metrics for both networks, I’m unsure what insights you glean. Conventional crowdsourcing doesn’t involve random samples of people within a country. Even if Network B is crummy and has a small coverage footprint, people who use it will tend to live within its coverage footprint. People living elsewhere will opt for Network A and its larger coverage footprint. It’s a classic case of selection bias.
- Coverage Critic’s approach mitigates but does not eliminate many of the issues with the conventional approaches. Coverage Critic’s technique also has its share of unique downsides. Notably, the data collected focuses single-handedly on signal quality. Other approaches involve collection of richer data on more metrics. For the moment, Coverage Critic’s crowdsourcing doesn’t directly collect information on speeds, latency, or jitter. Data is also not collected about frequency bands or 5G networks. But, hey, these are the early days.