PCMag Releases 2020 Cellular Performance Report

PCMag just released its 2020 report on the performance of cellular networks.

  • Verizon took the top spot for overall performance.
  • AT&T came in a close second.
  • T-Mobile came in third place but led in 5G availability.

Differences from previous years’ tests

Due to logistical issues from the pandemic, PCMag altered its methodology:

Traditionally, we’d tour each city and then test rural areas between cities before moving on to the next one. But that involves flights, rental cars, and hotels, none of which we felt safe using this year. So we hired roughly two dozen drivers to each test their own cities, in their own cars, sleeping in their own beds, shipping the testing kits from place to place. The result is a nationwide, COVID-safe test, but without the rural data we usually provide.

PCMag also started placing more emphasis on 5G connections. I’m a big fan of how PCMag handled 5G performance in its scoring (emphasis mine):

We had separate sets of 4G and 5G phones running tests offset by 60 seconds from each other…We ended up choosing the best result from each of the two devices on the same network, no matter what G they were on…What people really want is a consistent broadband experience—they don’t care what the icon on their phone says.

Reservations

Most of my reservations last year still stand. Notably:

  • PCMag focuses on performance within cities, while the largest differences between networks’ performance tend to show up in less-populated areas.
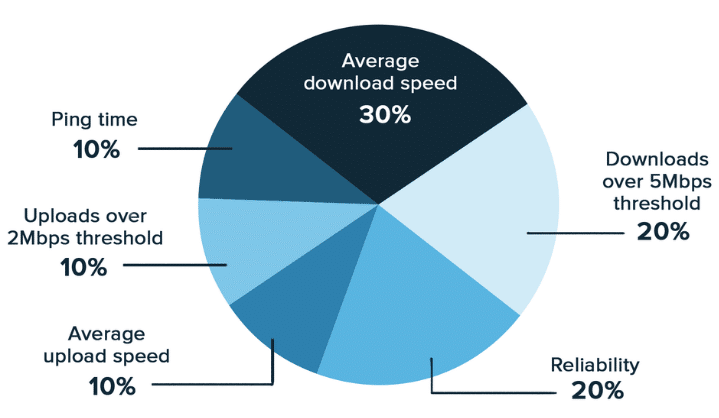
  • Average speed metrics get more weight than I think is reasonable.
  • Scores on different metrics get aggregated in a problematic way.

Highlights

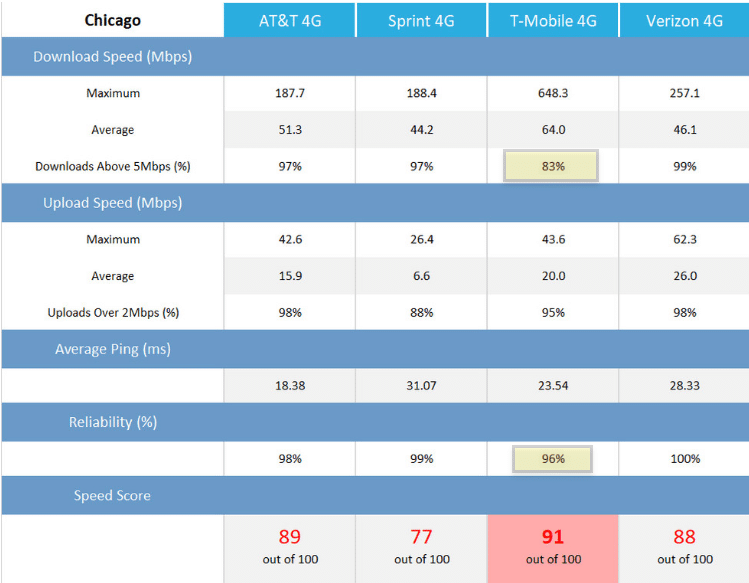
While my reservations are serious, they’re not relevant to the granular, city-specific results. If you live in a large metro area, PCMag’s scorecard for your city could be handy.

The 5G-availability data is interesting. Here’s each network’s overall score for 5G availability:

  • T-Mobile: 54%
  • AT&T: 38%
  • Verizon: 4%

I’m surprised how close AT&T came to T-Mobile. While Verizon’s 4% availability score isn’t impressive, it’s higher than I anticipated. Verizon has been getting berated for the horrible availability of its exclusively millimeter wave 5G. Since Verizon hasn’t rolled out any 5G in some cities, the overall result masks heterogeneity between cities. E.g., PCMag found 9% 5G availability for Verizon in Chicago.

PCMag’s 2019 Network Tests — My thoughts

Summary

On June 20, PCMag published its latest results from performance testing on the major U.S. wireless networks. Surprisingly, AT&T rather than Verizon took the top spot in the overall rankings. I expect this was because PCMag places far more weight on network performance within cities than performance in less-populated areas.

In my opinion, PCMag’s methodology overweights average upload and download speeds at the expense of network reliability. Despite my qualms, I found the results interesting to dig into. PCMag deserves a lot of credit for its thoroughness and unusual level of transparency.

Testing methodology

PCMag claims to be more transparent about its methodology than other entities that evaluate wireless networks.1 I’ve found this to be true. PCMag’s web page covering its methodology is detailed. Sascha Segan, the individual who leads the testing, quickly responded to my questions with detailed answers. I can’t say anything this positive about transparency demonstrated by RootMetrics or OpenSignal.

To measure network performance, PCMag used custom speed test software developed by Ookla. The software was deployed on Samsung Galaxy S10 phones that were driven to 30 U.S. cities as they collected data.2 In each city, stops were made in several locations for additional data collection. PCMag only recorded performance on LTE networks. If a phone was connected to a non-LTE network (e.g., a 3G network) during a test, the phone would fail that test.3 PCMag collected data on six metrics:4

  • Average download speed
  • Percent of downloads over a 5Mbps speed threshold
  • Average upload speed
  • Percent of uploads over a 2Mbps speed threshold
  • Reliability (percent of the time a connection was available)
  • Latency

The Galaxy S10 is a recent, flagship device and has essentially the best technology available for high-performance on LTE networks. Accordingly, PCMag’s test are likely to show better performance than consumers using lower-end devices will experience. PCMag’s decision to use the same high-performance device on all networks may prevent selection bias that sometimes creeps up in crowdsourced data when subscribers on one network tend to use different devices than subscribers on another network.5

In my opinion, PCMag’s decision not to account for performance on non-LTE networks somewhat limits the usefulness of its results. Some network operators still use a lot of non-LTE technologies.

Scoring

PCMag accounts for networks’ performance on several different metrics. To arrive at overall rankings, PCMag gives networks a score for each metric and assigns specific weights to each metric. Scoring multiple metrics and reasonably assigning weights is far trickier than most people realize. A lot of evaluation methodologies lose their credibility during this process (see Beware of Scoring Systems).

PCMag shares this pie chart when describing the weights assigned to each metric:6

The pie chart doesn’t tell the full story. For each metric, PCMag gives the best-performing network all the points available for that metric. Other networks are scored based on how far they are away from the best-performing network. For example, if the best-performing network has an average download speed of 100Mbps (a great speed), it will get 100% of the points available for average download speed. Another network with an average speed of 60Mbps (a good speed) would get 60% of the points available for average download speed.

The importance of a metric is determined not just by the weight it’s assigned. The variance in a metric is also extraordinarily important. PCMag measures reliability in terms of how often a phone has an LTE connection. Reliability has low variance. 100% reliability indicates great coverage (i.e., a connection is always available). 80% reliability is bad. Networks’ reliability barely affects PCMag’s rankings since reliability measures are fairly close to 100% even on unreliable networks.

The scoring system is sensitive to how reliability numbers are presented. Imagine there are only two networks:

  • Network A with 99% reliability
  • Network B with 98% reliability

Using PCMag’s approach, both network A and B would get a very similar number of points for reliability. However, it’s easy to change how the same metric is presented:

  • Network A has no connection 1% of the time
  • Network B has no connection 2% of the time

If PCMag put the reliability metric in this format, network B would only get half of the points available for reliability.

As a general rule, I think average speed metrics are hugely overrated. It’s important that speeds are good enough for people to do what they want to do on their phones. Having speeds that are way faster than the minimum speed that’s sufficient won’t benefit people much.

I’m glad that PCMag put some weight on reliability and on the proportion of tests that exceeded fairly minimum upload and download speed thresholds. However, these metrics just don’t have nearly as much of an effect on PCMag’s final results as I think they should. The scores for Chicago provide a good illustration:

Despite having the worst reliability score and by far the worst score for downloads above a 5Mbps threshold, T-Mobile still manages to take the top ranking. Without hesitation, I’d choose service with Verizon or AT&T’s performance in Chicago over service with T-Mobile’s performance in Chicago. (If you’d like to get a better sense of how scores for different metrics drove the results in Chicago, see this Google sheet where I’ve reverse engineered the scoring.)

To create rankings for regions and final rankings for the nation, PCMag combines city scores and scores for suburban/rural areas. As I understand it, PCMag mostly collected data in cities, and roughly 20% of the overall weight is placed on data from rural/suburban areas. Since a lot more than 20% of the U.S. population lives in rural or suburban areas, one could argue the national results overrepresent performance in cities. I think this puts Verizon at a serious disadvantage in the rankings. Verizon has more extensive coverage than other networks in sparsely populated areas.

While I’ve been critical in this post, I want to give PCMag the credit it’s due. First, the results for each metric in individual cities are useful and interesting. It’s a shame that many people won’t go that deep into the results and will instead walk away with the less-useful conclusion that AT&T took the top spot in the national rankings.

PCMag also deserves credit for not claiming that its results are the be-all-end-all of network evaluation:7

Other studies may focus on downloads, or use a different measurement of latency, or (in Nielsen’s case) attempt to measure the speeds coming into various mobile apps. We think our balance makes the most sense, but we also respect the different decisions others have made.

RootMetrics and OpenSignal are far less modest.